Visual guide to planning and scheduling construction projects using Gantt charts with critical path analysis
1. Introduction to Planning & Scheduling
Planning and scheduling are the backbone of successful construction projects. Yet they’re often treated as administrative checkboxes rather than strategic management tools. In reality, the schedule is your legal document, communication mechanism, forecasting tool, and control system all combined into one powerful instrument.
Every construction professional knows the phrase: “Time is money.” In construction, this isn’t just a cliché—it’s mathematical reality. A single day of delay on a 50-person crew costs approximately $1,500–$3,000 in incremental labor costs alone. Add equipment rental extensions, overhead allocation, and opportunity costs, and a week of delay easily runs $15,000–$35,000+ depending on project size and scope.
Table of Contents
But delays are just the visible cost. The hidden costs of poor scheduling are even more damaging:
- Coordination failures: When trades don’t know when they’re needed, rework multiplies
- Material waste: Items ordered too early deteriorate or must be stored at premium cost; ordered too late means rush charges
- Labor inefficiency: Crews stand idle waiting for preceding work, or work incomplete because following trades aren’t ready
- Quality problems: Rushed work leads to defects; inadequate time for testing means failures discovered too late
- Safety incidents: Compressed schedules force risks; overtime fatigue increases accidents
- Claims & disputes: Unclear schedules lead to disputes about who caused delays
Modern project scheduling goes far beyond simple Gantt charts drawn in Excel. Today’s construction managers—whether working for general contractors, specialty trades, owners, or engineering firms—must master:
- Critical Path Method (CPM): Understanding which activities truly control project duration and which have flexibility
- Resource management: Balancing labor, equipment, and materials across competing demands
- Schedule compression: Safely reducing duration when delays occur
- Risk-based contingency: Adding buffers precisely where uncertainty exists, not uniformly everywhere
- Integration with cost & budget: Connecting schedule milestones to cash flow projections and earned value metrics
- Agile/Lean approaches: Incorporating flexibility for complex, uncertain, or evolving projects
- Schedule analytics: Using performance metrics (SPI, SV) to forecast completion and take corrective action
This comprehensive masterclass covers all aspects of construction planning and scheduling—from fundamental concepts to advanced techniques used by major global contractors, engineering firms, and construction management companies. Whether you’re managing a $500K residential renovation, a $20M commercial building, or a $500M infrastructure megaproject, the principles remain consistent, though the complexity and sophistication scale up.
2. Why Planning & Scheduling Matters in Construction
2.1 Legal & Contractual Requirements
Your project schedule is a contractual document with legal implications. Most standard construction contracts (AIA A101, ConsensusDocs, FIDIC) require:
- Baseline schedule submittal before major work commences
- Regular schedule updates (monthly minimum) showing actual vs. planned progress
- Recovery schedules if delays occur, showing how the contractor will make up time
- Detailed schedule supporting claims if asserting impact from external delays
When disputes arise—and they do in roughly 30–40% of projects over $50M—your schedule becomes critical evidence in arbitration, mediation, or litigation.
Real example: A mechanical contractor claims a 45-day delay due to structural steel arriving late (owner’s responsibility). Without a detailed CPM schedule showing:
- When steel installation was originally planned to start (critical path activity)
- Which activities were on the critical path vs. which had float
- How the 45-day delay impacted the overall project completion date
- What activities in MEP, electrical, plumbing, and finish depended on steel completion
…the claim will be rejected or severely discounted. With a proper schedule demonstrating the critical path impact, the same claim might be awarded $500K–$2M in time-related costs.
Conversely, owners use schedules defensively. If a contractor claims delay, the owner’s schedule becomes evidence that the contractor mismanaged resources, failed to coordinate trades effectively, or didn’t accelerate when problems arose.
2.2 Cost & Cash Flow Control
The schedule directly drives the project budget and cash flow. Construction companies depend on accurate cash flow forecasts to:
- Fund project execution (payroll, equipment, materials, subcontractor payment)
- Manage working capital (the gap between when you spend money and when you invoice/get paid)
- Meet banking covenants (lenders require certain cash positions and financial ratios)
- Plan company finances (knowing when $5M will be spent vs. received)
Example of schedule-cash flow impact:
Baseline schedule says:
Month 1: $500K work completed
Month 2: $800K work completed
Month 3: $1,200K work completed
Total 3 months: $2,500K

Actual progress (after schedule variance):
Month 1: $300K work completed (60% of plan)
Month 2: $600K work completed (75% of plan)
Month 3: $900K work completed (75% of plan)

Impact:
- Forecast shortfall: $700K cumulative by month 3
- If project-financed, this triggers default on construction loan
- Contractor must inject additional capital or face foreclosure
- Subcontractors don't get paid on time; they threaten to walk off job
- Materials suppliers cut credit terms; rush orders cost more
- Project costs escalate 5–15% due to expediting, premium pricing, rework
Cash flow forecasting is essential. Many contractors go bankrupt not because projects are unprofitable, but because they run out of cash before receiving payment. An accurate schedule is the foundation of cash flow forecasting.
2.3 Resource Management & Allocation
Construction is fundamentally a resource-intensive business. The schedule determines:
Labor allocation:
- How many workers are needed in each phase (10 workers month 1, 40 workers month 3, 15 workers month 5)
- Crew composition and skill mixes
- Duration each trade is on site
- Learning curve and productivity ramp-up
Equipment scheduling:
- Crane rental periods (often $20,000–$50,000/month)
- Lift equipment, scaffolding, temporary power systems
- Optimization to minimize idle time and duplicate rentals
Material procurement & delivery:
- Long-lead items ordered months in advance (HVAC equipment 12 weeks, custom glass 10 weeks, structural steel 8 weeks)
- Just-in-time delivery to minimize storage costs but avoid delays
- Supplier coordination (no show-up, no delivery without receiving crew ready)
Subcontractor coordination:
- When each trade is needed
- How long they can occupy space (electrical rough-in takes 3 weeks; fire protection takes 2 weeks; HVAC takes 4 weeks)
- Sequence to minimize conflicts (can’t install drywall until MEP is rough-in complete)
Without a schedule, contractors either:
- Understaff → Work moves slowly; projects drag beyond expected duration; overhead accumulates
- Overstaff → Labor stands idle; inefficient; workers laid off prematurely; morale suffers; safety incidents increase
- Miss supplier lead times → Materials don’t arrive when needed; work stops; panic orders at premium prices; schedule slips further
Real example: Major mechanical subcontractor
A 1,200-ton HVAC contract on a $150M hospital project required:
- 6 chiller units (12-week lead time, $80K each = $480K total cost)
- 100+ rooftop units (8-week lead time, $30K each = $3M cost)
- 50+ miles of piping, thousands of hangers, controls, etc.
The GC’s schedule showed equipment arriving month 6, installation months 7–9, testing month 10.
But the GC delayed notice-to-proceed by 2 months. Suddenly the chiller order is placed month 2 (instead of month 1). Delivery: month 8 (instead of month 7). Installation can’t start until month 8. Testing can’t start until month 10. Completion pushed from month 10 to month 11.
One month delay cascades through the entire project. The mechanical contractor absorbs an extra $120K in labor (crew standing idle, extended supervision). The GC loses a month of contractor overhead recovery. The owner faces a month delay in occupancy (tenants delayed, operational revenue lost).
Proper scheduling prevents this cascade.
2.4 Stakeholder Communication & Coordination
Every stakeholder has different interests and needs around schedule:
Owner/Client:
- “When can I occupy this building?”
- “When will I get ROI from this investment?”
- “Who’s responsible if we don’t hit the date?”
Tenants/Users:
- “When do I need to vacate the old space?”
- “When can I move into the new space?”
- “How long will the project disrupt my business?”
Subcontractors:
- “When will I be on the critical path?”
- “How long will my phase last?”
- “When does my crew need to show up?”
- “When do I need to have my people ready?”
Material suppliers/Vendors:
- “When should we manufacture/deliver?”
- “How long do you need our equipment on site?”
- “When can we come back and pick up?”
Regulatory authorities:
- “When will inspections be needed?”
- “What permits are required for this phase?”
- “How long is the testing & commissioning window?”
Lenders/Financial partners:
- “When will major milestones occur?”
- “When is completion?”
- “What are the payment milestones?”
A transparent, detailed, realistic schedule:
- Aligns everyone around the same plan
- Reduces conflicts and surprises
- Enables early warning if delays are coming
- Supports collaborative problem-solving
- Builds trust between parties
2.5 Risk Management & Mitigation
The schedule is where you identify and mitigate project risks proactively:
Weather risks:
- Plan heavy concrete work in summer/fall, not winter (concrete sets poorly in cold)
- Schedule interior finishing in winter (less weather-dependent)
- Add weather buffers for outdoor work (assume 10–20% lost days in winter regions)
Long-lead item risks:
- Identify items with 8+ week lead times in pre-construction
- Place orders early; accept delivery 2–4 weeks before needed rather than risk delays
- Coordinate with suppliers on delivery dates; build in buffer time
Permit & approval risks:
- Front-load applications; don’t wait until ready to build
- Plan for 2–3 revision cycles; estimate 4–8 weeks per cycle
- Schedule work that doesn’t require permits while awaiting approval
Testing & commissioning risks:
- Don’t assume systems work perfectly first time
- Budget 2–3 weeks for HVAC commissioning (tuning, balancing)
- Budget time for rework based on test failures
- Include FAT (Factory Acceptance Test) and SAT (Site Acceptance Test) explicitly
Learning curve risks:
- New crews/processes take 20–40% longer initially
- Add buffer time for first repetitions
- Don’t assume productivity ramps to plan by day 3
Subcontractor coordination risks:
- If A and B must coordinate, add buffer in case B’s preceding work isn’t done
- Explicitly schedule buffer time between phases
- Don’t assume back-to-back transitions without contingency
Without proactive risk scheduling, these risks become crises:
- Weather hits → no contingency → schedule slips
- Permit delayed → no buffer → critical path pushed back
- Supplier misses delivery → panic expediting → cost overrun
- System fails testing → no rework time → completion delayed
3. Understanding Construction Workflow & Work Breakdown Structure
Before building a schedule, you must understand how construction actually works. This isn’t abstract—it’s the physical sequence of work on the job site.
3.1 Typical Construction Workflow
Residential building example (simplified):
Phase 1: SITE WORK & FOUNDATION
├─ Clearing & demolition
├─ Site grading & drainage
├─ Underground utilities (water, sewer, gas, power)
├─ Foundation excavation
├─ Foundation formwork
├─ Rebar placement
├─ Concrete pour
├─ Concrete curing (28 days, but can build on at 7 days)
└─ Foundation inspection

Phase 2: STRUCTURAL FRAME
├─ Framing lumber/steel delivery
├─ Floor framing (joists, beams, decking)
├─ Vertical framing (walls, posts, braces)
├─ Roof framing (trusses, decking, sheathing)
└─ Structural inspection

Phase 3: ENCLOSURE (Parallel with structural)
├─ Exterior walls (sheathing, housewrap)
├─ Windows & exterior doors (rough-in)
├─ Roofing (underlayment, shingles)
├─ Exterior finishes (cladding, siding)
└─ Building envelope inspection

Phase 4: MEP ROUGH-IN (Parallel with enclosure)
├─ HVAC rough-in (ductwork, units)
├─ Plumbing rough-in (supply, drain, vent lines)
├─ Electrical rough-in (wire, conduit, boxes, panels)
└─ MEP inspection

Phase 5: INSULATION & DRYWALL
├─ Insulation (walls, ceiling, basement)
├─ Drywall hanging (joint compound, taping)
├─ Drywall finishing (mudding, sanding, paint prep)
└─ Drywall inspection

Phase 6: INTERIOR FINISH
├─ Flooring (underlayment, installation)
├─ Interior doors & trim
├─ Cabinets & countertops
├─ Paint & stain
├─ Lighting fixtures & switches
└─ Interior finish inspection

Phase 7: FINAL MEP
├─ HVAC testing & commissioning
├─ Plumbing final (fixtures, testing)
├─ Electrical final (devices, testing)
└─ MEP final inspection

Phase 8: FINAL WALK & CLOSEOUT
├─ Punchlist completion
├─ Final cleaning
├─ Utility connections & testing
├─ Final inspection & occupancy permit
└─ Occupancy
Key observations:
- Phases overlap (structural doesn’t finish before enclosure starts)
- Some trades run parallel (MEP rough-in happens during framing)
- Sequential dependencies (can’t hang drywall until MEP is rough-in complete)
- Inspections are critical (foundation before framing, structural before enclosure, MEP before drywall)
- Testing & commissioning takes time (HVAC balancing, electrical functional testing)
3.2 Work Breakdown Structure (WBS)
A Work Breakdown Structure is a hierarchical decomposition of all work in the project.
Example WBS for 100-unit residential project:
PROJECT: 100-Unit Residential Community

├─ SITE DEVELOPMENT
│  ├─ Site prep & demolition
│  ├─ Utilities (water, sewer, gas, electric, telecom)
│  ├─ Site civil (roads, drainage, landscaping)
│  ├─ Common area buildings
│  └─ Site amenities (pool, clubhouse, parking)
│
├─ BUILDING A (25 units)
│  ├─ Foundation & structural
│  ├─ Enclosure
│  ├─ MEP rough-in
│  ├─ Interior finish
│  ├─ Final MEP
│  └─ Closeout
│
├─ BUILDING B (25 units)
│  ├─ Foundation & structural
│  ├─ Enclosure
│  ├─ MEP rough-in
│  ├─ Interior finish
│  ├─ Final MEP
│  └─ Closeout
│
├─ BUILDING C (25 units)
│  └─ (same structure)
│
├─ BUILDING D (25 units)
│  └─ (same structure)
│
└─ PROJECT CLOSEOUT
   ├─ Final inspections
   ├─ Punchlist resolution
   └─ Project completion
Why WBS matters:
- Ensures nothing is forgotten (complete scope coverage)
- Enables clear responsibility assignment (who owns foundation? Who owns MEP?)
- Supports accurate estimating (break down to manageable pieces)
- Facilitates schedule building (each WBS element becomes one or more schedule activities)
4. Duration Estimating Techniques & Methods
Before you can build a schedule, you must estimate how long each activity will take. This is harder than it sounds and is the source of many scheduling problems.
4.1 Analogous (Historical) Estimation
Use actual data from similar past projects.
Pros:
- Based on real historical performance
- Quick to develop
- Requires less detailed analysis
Cons:
- Assumes conditions are identical (crew skill, weather, complexity)
- Can perpetuate past inefficiencies
- Not suitable for novel work or novel conditions
Example:
Past project: 40,000 sq ft office building
- Structural steel erection: 8 weeks
- 150 tons of steel = 18.75 tons per week

Current project: 60,000 sq ft office building
- 220 tons of steel
- Using historical rate: 220 ÷ 18.75 = 11.7 weeks

But wait—is the current project's steel more complex?
Are the crews the same skill level?
Is the current site access better/worse?
Use analogous estimation for initial budget estimates, not detailed schedules.
4.2 Parametric Estimation
Estimate based on productivity rates per unit of work.
Common parametric rates in construction:
Concrete placement: 10–15 cubic yards per day per crew
Concrete finish: 500–1,000 sq ft per day per crew
Drywall hanging: 800–1,500 sq ft per day per crew
Drywall taping & mudding: 1,000–2,000 sq ft per day per crew
Electrical rough-in: 15–25 outlets per day per electrician
Plumbing rough-in: 10–15 fixtures per day per plumber
Framing: 200–400 sq ft per day per crew
Roofing: 300–500 sq ft per day per crew
Painting: 1,000–2,000 sq ft per day per painter
Flooring installation: 500–1,000 sq ft per day per crew
Formula:
Duration (days) = Total Quantity ÷ (Productivity Rate × Number of Crews)

Example: Drywall hanging
Quantity: 50,000 sq ft
Productivity: 1,000 sq ft/day/crew
Crews: 2
Duration = 50,000 ÷ (1,000 × 2) = 25 days
Pros:
- Science-based; reproducible
- Scalable (if you add crews, duration drops proportionally)
- Accounts for crew size explicitly
Cons:
- Assumes constant productivity (ignores learning curve, fatigue, weather)
- Requires accurate productivity benchmark data
- Difficult for complex, one-of-a-kind work
- Doesn’t account for setup/teardown, mobilization
Parametric rates vary significantly:
textDrywall hanging in ideal conditions: 1,500 sq ft/day/crew
Drywall hanging in congested mechanical room: 400 sq ft/day/crew
(Difference: 3.75× longer in difficult conditions)

Concrete placement in accessible location: 15 cubic yards/day
Concrete placement in complex geometry with heavy rebar: 6 cubic yards/day
(Difference: 2.5× longer in difficult conditions)
Lesson: Parametric rates are starting points, not gospel. Adjust for site-specific conditions.
4.3 Bottom-Up Estimation
Break work into small, manageable pieces; estimate each; sum the total.
Example: Interior partition wall (1,000 sq ft)
textActivity: Frame, insulate, drywall, finish partition wall

FRAMING:
  Layout & mark: 4 hours
  Cut & assemble top/bottom plates: 6 hours
  Install studs & blocking: 10 hours
  Install backing for fixtures: 3 hours
  Subtotal: 23 hours ÷ 8 hours/day = 2.9 days

INSULATION:
  Staple wire (if required): 2 hours
  Install batts: 6 hours
  Cut & fit around penetrations: 3 hours
  Subtotal: 11 hours ÷ 8 = 1.4 days

DRYWALL:
  Hang drywall: 12 hours (2 crew, 1,000 sq ft @ 1,000 sq ft/day/crew)
  Tape & mud coat 1: 6 hours
  Tape & mud coat 2: 5 hours
  Tape & mud coat 3: 4 hours
  Sand: 3 hours
  Subtotal: 30 hours ÷ 8 = 3.75 days

FINISH:
  Paint: 4 hours (1,000 sq ft @ 2,000 sq ft/day)
  Caulk & touch-up: 2 hours
  Install trim & baseboard: 6 hours
  Subtotal: 12 hours ÷ 8 = 1.5 days

TOTAL: 2.9 + 1.4 + 3.75 + 1.5 = 9.55 days (approximately 10 days)
Pros:
- Most accurate when done well
- Forces detailed thinking about work content
- Reveals hidden tasks (backing, caulking, touch-up)
- Customizable to actual conditions
Cons:
- Time-consuming to develop
- Requires experienced estimators
- Easy to miss minor tasks that add up
- Can become overly detailed/unwieldy
Bottom-up is the gold standard for detailed project scheduling.
4.4 PERT (Three-Point) Estimation
Use optimistic, likely, and pessimistic estimates to account for uncertainty and variability.
Formula:
textExpected Duration = (Optimistic + 4×Likely + Pessimistic) ÷ 6

This gives 4× weight to "likely" and 1× weight to optimistic and pessimistic.
Statistically, this approximates a normal distribution of outcomes.
Example: Structural steel erection
textOptimistic (everything goes right):
- Perfect weather, all bolts line up, no field rework: 6 weeks

Likely (normal conditions):
- Some weather delays, minor field adjustments: 8 weeks

Pessimistic (worst case):
- Weather delays, bolt hole misalignment, major rework: 12 weeks

Expected Duration = (6 + 4×8 + 12) ÷ 6 = (6 + 32 + 12) ÷ 6 = 50 ÷ 6 = 8.33 weeks

Compare:
- Optimistic alone (wishful): 6 weeks
- Likely alone (realistic): 8 weeks
- Expected (accounts for risk): 8.33 weeks
- Pessimistic alone (worst case): 12 weeks
Pros:
- Accounts for uncertainty and variability
- More realistic than point estimates
- Standard in risk management frameworks (PMBOK, PRINCE2)
- Helps identify high-risk activities
Cons:
- Estimators often overconfident (underestimate pessimistic)
- Takes longer to develop
- Requires statistical literacy to explain to stakeholders
Typical ranges:
textOptimistic to Pessimistic ratio:
- Low uncertainty (familiar tasks): 1:1.5 ratio (5 days optimistic, 7.5 pessimistic)
- Moderate uncertainty (complex tasks): 1:2 ratio (5 days optimistic, 10 pessimistic)
- High uncertainty (novel, weather-dependent): 1:3+ ratio (5 days optimistic, 15+ pessimistic)
5. Baseline Schedule Development Process
A baseline schedule is the approved plan against which actual progress is measured. It’s the project’s version of truth and becomes contractual once accepted.
5.1 What Makes a Good Baseline?
✅ Realistic: Based on honest duration estimates and real resource availability
✅ Detailed: Activities broken into 2–5 day durations (not “Phase 2: 3 months”)
✅ Logically linked: Proper dependencies showing logical workflow
✅ Resource-loaded: Labor, equipment, and material needs assigned
✅ Approved: Owner, GC, and major subs all formally accept
✅ Achievable: The team believes they can execute it
✅ Buffered: Contingency for known risks, not for poor management
5.2 Step-by-Step Baseline Development
STEP 1: Define Project Scope & Major Phases
textWhat is this project?
- 100,000 sq ft office building
- 8 stories
- $85M contract value
- 24-month duration requirement

What are the major phases/deliverables?
Phase 1: Site mobilization, utility coordination, foundation
Phase 2: Structural frame (steel erection)
Phase 3: Enclosure (roofing, exterior, windows)
Phase 4: MEP rough-in (HVAC, electrical, plumbing)
Phase 5: Interior finishes (drywall, paint, flooring, fixtures)
Phase 6: Final MEP (testing, commissioning)
Phase 7: Closeout (punchlist, occupancy permit)
STEP 2: Create Detailed WBS for Each Phase
textPHASE 2: STRUCTURAL FRAME

├─ Structural steel delivery
├─ Erection preparation (material staging, crew mobilization)
├─ Column installation (floors 1-2)
├─ Column installation (floors 3-4)
├─ Column installation (floors 5-6)
├─ Column installation (floors 7-8)
├─ Beam installation (floors 1-2)
├─ Beam installation (floors 3-4)
├─ Beam installation (floors 5-6)
├─ Beam installation (floors 7-8)
├─ Deck placement (floors 1-8)
├─ Composite deck curing
├─ Bolting & welding final connections
├─ Steel inspection & approval
└─ Structural steel demobilization
STEP 3: Estimate Duration for Each Activity
(Using techniques from Section 4)
textStructural steel delivery: 2 days (receiving, unloading, inspection)
Erection preparation: 1 week (staging, hoisting equipment setup)
Column installation (floors 1-2): 2 weeks (crane-limited, 4-5 pieces/day)
Column installation (floors 3-4): 2 weeks
Column installation (floors 5-6): 2 weeks
Column installation (floors 7-8): 2 weeks
Beam installation (floors 1-2): 1.5 weeks (follows columns closely)
Beam installation (floors 3-4): 1.5 weeks
...
STEP 4: Establish Logic & Dependencies
textStructural Steel Erection (simplified):

Delivery → Staging → Erection Prep → Begin Columns
                                        ↓
                                   Columns 1-2 → Columns 3-4 → Columns 5-6 → Columns 7-8
                                      ↓              ↓              ↓              ↓
                                   Beams 1-2 → Beams 3-4 → Beams 5-6 → Beams 7-8
                                                                                   ↓
                                                                            Deck Placement
                                                                                   ↓
                                                                            Curing (28 days)
                                                                                   ↓
                                                                            Final Connections
                                                                                   ↓
                                                                         Inspection & Sign-Off
Key relationships:
- Finish-to-Start (FS): Standard sequence (finish one, start next)
- Start-to-Start (SS) with lag: Beams can start 3 days after columns (allows column crew to get ahead)
- Finish-to-Finish (FF): Inspection starts after all connections complete, finishes when all tested
STEP 5: Assign Resources
textStructural Steel Erection:
- Erection crew: 8–12 people (including foreman, iron workers, laborers, safety)
- Crane: 1× 300-ton crane (on-site continuously for 6 months)
- Welders: 2–4 (shift basis during fast-track periods)
- Inspectors: 1 (full-time, third-party verification)

Equipment costs: $300K/month crane rental × 6 = $1.8M
Labor costs: $800K/month crew × 6 = $4.8M
Total structural phase budget: ~$7M
STEP 6: Identify the Critical Path
(Covered in detail in Section 6; the longest sequence of dependent activities)
textIn the example above:
Delivery → Staging → Prep → Columns → Beams → Deck → Curing (28 days) → Connections → Inspection

If deck placement takes 3 weeks and curing takes 28 days, curing becomes the critical path constraint
for this phase. Any slip in deck work pushes the entire project 1:1.
STEP 7: Add Contingency & Risk Buffers
textCritical path: 24 weeks (structural phase)

Risk buffers:
- Weather delays (outdoor work, winter region): +2 weeks
- Material delivery slippage: +1 week
- Rework/inspection failures: +1 week
- Learning curve (if crews new to this): +1 week

Total contingency: 5 weeks

Baseline with contingency: 24 + 5 = 29 weeks
STEP 8: Validate & Get Approval
textPresent to:
- Owner (does the timeline meet their business needs?)
- General contractor (can they execute? Do they have crews available?)
- Structural steel fabricator (can they deliver on schedule?)
- Trades following this phase (do they have crews available when needed?)

Gather feedback:
- "We need the building 2 weeks earlier for tenant fitout"
  → May require acceleration (cost + risk)
- "Our crew isn't available until week 4; we're tied up on another project"
  → May require subcontractor change or delay
- "We need 4 weeks for material testing before we can ship"
  → May require early design freeze

Incorporate feedback; revise schedule; resubmit

Get written approval: Owner, GC, major subs all sign off

Lock the baseline: This is the plan against which progress is measured
6. Critical Path Method (CPM) Deep Dive
The Critical Path is the longest sequence of dependent activities in your project. It determines the absolute minimum project duration. Any delay on the critical path delays the entire project.
6.1 Understanding Critical Path
Simple example:
textProject: Kitchen renovation

Activity A: Demolition (5 days)
  ↓ (must finish before B)
Activity B: Rough plumbing & electrical (7 days)
  ↓ (must finish before C)
Activity C: Drywall (4 days)
  ↓ (must finish before D)
Activity D: Paint (2 days)
  ↓ (must finish before E)
Activity E: Flooring (3 days)
  ↓ (must finish before F)
Activity F: Cabinets & countertops (6 days)
  ↓ (must finish before G)
Activity G: Fixture installation (2 days)
  ↓ (must finish before H)
Activity H: Final walk & cleanup (1 day)

TOTAL SERIAL DURATION: 5+7+4+2+3+6+2+1 = 30 days

But what if some activities can run in parallel?
Parallel example:
textA: Demolition (5 days)
  ├─→ B: Rough plumbing (7 days) ────┐
  ├─→ C: Electrical rough-in (5 days) ├─→ D: Drywall (4 days) ─→ E: Paint (2 days) ─→ F: Flooring (3 days)
  └─→ G: HVAC rough-in (6 days) ─────┘

Followed by:
H: Cabinets & counters (6 days)
I: Fixtures (2 days)
J: Final walk (1 day)

Parallel paths:
Path 1: A → B → D → E → F → H → I → J
        = 5 + 7 + 4 + 2 + 3 + 6 + 2 + 1 = 30 days (LONGEST)

Path 2: A → C → D → E → F → H → I → J
        = 5 + 5 + 4 + 2 + 3 + 6 + 2 + 1 = 28 days

Path 3: A → G → D → E → F → H → I → J
        = 5 + 6 + 4 + 2 + 3 + 6 + 2 + 1 = 29 days

CRITICAL PATH: Path 1 (30 days = project duration)
Key insight: B (rough plumbing, 7 days) is on the critical path and has ZERO FLOAT.
C (rough electrical, 5 days) is NOT on the critical path and has 2 days of float.
If B slips 1 day, the project slips 1 day.
If C slips 2 days, the project doesn’t slip (it still has 2 days of buffer).
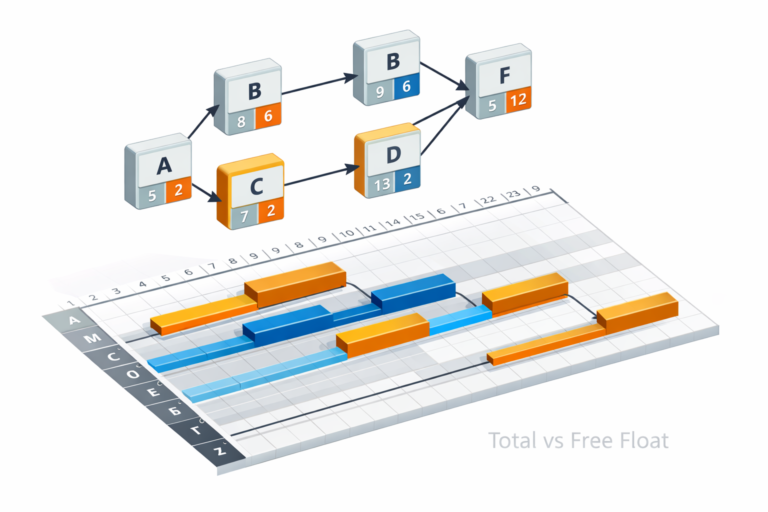
6.2 Float vs. Slack
Float (or Slack) is the amount of time an activity can be delayed without delaying the project.
Calculation:
textTotal Float = Latest Start (LS) - Earliest Start (ES)

Or equivalently:
Total Float = Latest Finish (LF) - Earliest Finish (EF)
Example:
textActivity B: Rough plumbing
- Earliest start: Day 6 (after demolition on day 5)
- Earliest finish: Day 12 (day 6 + 7 days work)
- Latest start: Day 6 (must start on day 6 to avoid delaying critical path)
- Latest finish: Day 12
- Total float: 6 - 6 = 0 days (CRITICAL PATH)

Activity C: Rough electrical
- Earliest start: Day 6 (after demolition)
- Earliest finish: Day 10 (day 6 + 5 days work)
- Latest start: Day 8 (can delay up to 2 days without impacting D's start on day 10)
- Latest finish: Day 12
- Total float: 8 - 6 = 2 days

If C starts on day 6 or day 7 or day 8, project still finishes day 30.
If C starts on day 9, then C finishes day 13 (not day 12), pushing drywall start to day 13
(not day 10), which pushes completion to day 31.
Types of float:
- Total Float: How much this activity can slip without delaying project completion
- Free Float: How much this activity can slip without delaying the next activity
(may have free float but no total float if project overall is tight)
7. Dependencies, Logic Relationships & Network Diagrams
Dependencies define the logical sequence of work. They’re the foundation of CPM scheduling.
7.1 Four Dependency Types
1. Finish-to-Start (FS) – Most common
One activity must finish before the next starts.
textExcavation (FS) → Foundation formwork

Can't start formwork until excavation is complete.
Typical relationship in construction.
Can add lag (delay):
textConcrete pour (FS+7) → Formwork removal

After concrete is poured, wait 7 days for curing before removing forms.
2. Start-to-Start (SS) – Concurrent work starts together or with offset
textFraming (SS lag 2 weeks) → MEP rough-in

Framing and MEP can both be happening; MEP starts 2 weeks after framing starts.
This allows overlap and parallel work.
3. Finish-to-Finish (FF) – Second activity finishes when first finishes
textPainting (FF) → Final walk & punchlist

Both painting and punchlist finish together.
Punchlist includes final touch-ups to paint.
4. Start-to-Finish (SF) – Rare, unusual
One activity starting triggers the end of another.
textEquipment removal crew arrives (SF) → Equipment still on site

This is unusual and generally indicates poor sequencing.
Avoid unless absolutely necessary.
7.2 Building Logic Networks
Poor logic:
textExcavation (FS) → Foundation (FS) → Framing
                      ↓ (also FS to MEP)
                      MEP starts when foundation is done

Problem: MEP should start after framing begins, not wait for framing completion.
This serializes work that should be parallel, inflating the schedule.
Better logic:
textExcavation (FS) → Foundation (FS) → Framing (SS lag 0 MEP starts same day)
                                       ↓ (SS lag 2 weeks)
                                       MEP starts 2 weeks after framing

Or even better:
Excavation (FS) → Foundation (FS) → Framing (SS lag 0)
                      ↓ (FS)
                   Formwork removal → MEP starts when forms are off
                                       ↓ (FS)
                      ↓ (both FS to Drywall)
                      ↓ (both SS lag 1 week to Drywall)
                      Drywall
Rules for good logic:
✅ Use FS for activities that must be sequential
✅ Use SS for concurrent work with offsets
✅ Use FF only when activities genuinely finish together
✅ Avoid SF (almost always indicates poor planning)
✅ Minimize lag; use lag only when there’s a real reason (curing time, permit review cycle)
✅ Don’t create artificial constraints that can be parallelized
8. Resource Planning, Allocation & Leveling
Resources are the people, equipment, and materials that perform the work. Proper allocation ensures efficiency; poor allocation wastes money.
8.1 Resource-Loaded Scheduling
Every activity should have explicit resource assignments:
textActivity: Structural steel erection (6 weeks)
Resources assigned:
- Crane operators: 2 (8 hours/day)
- Iron workers: 8 (8 hours/day)
- Laborers: 4 (8 hours/day)
- Safety officer: 1 (8 hours/day)
- Foreman: 1 (8 hours/day)
- Equipment: 1× 300-ton crane

Total labor: 16 workers × 30 days × 8 hours = 3,840 labor hours
Equipment: Crane $25K/week × 6 weeks = $150K
Benefits of resource loading:
- Identifies conflicts: Two activities assigned same equipment at same time
- Enables leveling: Can shift activities to smooth labor demand
- Supports cost tracking: Known labor hours × rates = cost forecast
- Identifies efficiency: Too many resources → inefficiency; too few → delay
8.2 Resource Leveling
Leveling smooths resource demand by shifting flexible activities.
Before leveling:
textWeek 1: 30 workers (site prep, excavation)
Week 2: 50 workers (foundation work + site work continues)
Week 3: 15 workers (foundation curing, minimal work)
Week 4: 45 workers (framing starts while foundation ending)
Week 5: 50 workers (peak framing)
Week 6: 20 workers (framing complete, MEP starts)

Peak: 50 workers
Valley: 15 workers
High variability makes hiring/firing difficult, inefficient
After leveling (shift MEP rough-in to start earlier, use FF relationship):
textWeek 1: 28 workers (more balanced)
Week 2: 32 workers
Week 3: 30 workers
Week 4: 30 workers
Week 5: 32 workers
Week 6: 28 workers

Peak: 32 workers (more predictable)
Valley: 28 workers (more even)
Variability reduced → easier crew management, higher retention, less overtime
Trade-off: May extend critical path slightly, but benefits often outweigh cost.
9. Schedule Compression & Time Management
When delays occur (and they will), you need strategies to recover time without massive cost overruns.
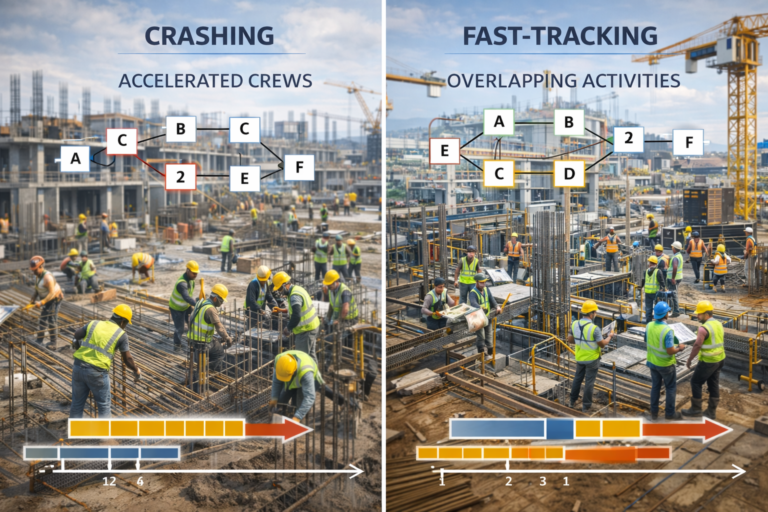
9.1 Compression Strategies
Strategy 1: Crashing (add resources)
textActivity: Concrete framing (originally 20 days with 10 workers)

Crash by adding workers:
- Original: 20 days × 10 workers = 200 labor days
- Crashed: 14 days × 20 workers = 280 labor days
- Cost increase: 80 extra labor days × $150/day = $12,000
- Time saved: 6 days
- Cost per day saved: $12,000 ÷ 6 = $2,000/day

Cost-benefit: If delay costs $3,000/day, crashing at $2,000/day is worth it.
If delay costs $1,000/day, crashing is too expensive.
Strategy 2: Fast-tracking (overlap activities)
textNormal sequence:
Design complete → Permitting (4 weeks) → Bidding (2 weeks) → Construction

Fast-track:
Design 80% complete → Early bid released → Permitting parallel with bidding
                                             ↓
                                        Construction starts before permits finalized

Savings: 4 weeks
Risk: If permits denied, rework required; if bid released before design final, changes needed

Use for: Projects with tight schedules where risk acceptable
Strategy 3: Work shifts / Extended hours
textOriginal: Single 8-hour shift, 5 days/week
Cost: 50 workers × 8 hours × 5 days = 2,000 labor hours/week

Compressed:
- 10-hour days: +20% labor hours, but fatigue reduces productivity → ~10% net gain
- 6-day weeks: +20% labor hours
- Double shifts: 2× crews, but coordination overhead → ~80% productivity vs. single shift

Double shifts example:
- 25 workers × 10 hours × 6 days × 2 shifts = 3,000 labor hours/week
- 50% productivity gain vs. original
- Overtime premium: +1.5× pay for extended hours, +2× pay for night shift
- Actual cost increase: ~100% (vs. 50% labor gain)
- Net cost per day saved: $10,000+

Use for: Short critical durations where tradeoff acceptable
Strategy 4: Eliminate non-critical work
textScope reduction:
- Remove non-essential finishes (premium paint, extra landscaping, decorative elements)
- Simplify MEP systems (fewer zones, basic controls vs. advanced)
- Defer items to Phase 2 (occupancy with partial completion)
- Accept temporary conditions (portable restrooms instead of final restrooms)

Cost: Reduced scope = reduced cost (sometimes)
Risk: Client satisfaction; may trigger claims; may not be acceptable
10. Agile & Lean Scheduling Methods for Construction
Not all construction fits traditional waterfall CPM. Complex, uncertain, or repetitive projects benefit from Agile and Lean approaches.
10.1 Agile Construction
Agile divides projects into 1–4 week sprints with continuous feedback and adaptation.
Typical sprint cycle:
textDay 1: Sprint planning (2 hours)
       "What will be done this week?"
       Define backlog items, assign tasks

Days 2–4: Daily standup (15 minutes)
         "What did we do yesterday? What are we doing today? What's blocked?"

Day 5: Sprint review + retrospective
       "What did we complete? What went well? What to improve?"
Agile board (visual management):
textTO DO | IN PROGRESS | DONE
│     │             │
├─ Rough electrical├─ Drywall section A  ├─ Excavation
├─ Plumbing lines  ├─ Paint prep area B  ├─ Foundation
├─ HVAC ductwork   └─ Install fixtures   ├─ Framing phase 1
└─ Fire alarm      └─ Final connections  └─ MEP rough-in
Pros:
- Flexibility: Adapt to changes, unforeseen conditions, new requirements
- Continuous communication: Daily standups surface issues immediately
- Early feedback: Client/owner sees progress; can course-correct
- Reduces rework: Regular reviews catch issues before they compound
Cons:
- Hard to forecast: Final scope may change; harder to predict costs
- Requires experienced teams: Agile needs self-organizing, skilled workers
- May not suit regulated work: Hospitals, critical infrastructure, high-risk projects need upfront detailed planning
10.2 Lean Construction / Takt Planning
Lean focuses on steady flow at consistent pace (takt = rhythm in German).
Example: Residential framing at 1 house per week takt time
textWeek 1: Crew on House A → Frame complete
Week 2: Crew on House A → Drywall starts; Crew on House B → Frame starts
Week 3: Crew on House A → Paint; House B → Drywall; House C → Frame starts
Week 4: Crew on House A → Floors; House B → Paint; House C → Drywall; House D → Frame

Steady state: Each crew finishes one house per week, moves to next
One house per week enters each phase
Predictable, even flow
Benefits:
- Reduced waste: Efficient staffing; no idle time
- Predictable: Each trade knows exactly when it starts each house
- Faster overall: Smooth flow without bottlenecks
- Better quality: Familiar sequence; crews get better at repetition
Cons:
- Requires standardization: All houses similar; not suitable for custom designs
- Difficult with variability: Site conditions, weather, permit variations break takt
- Low flexibility: Changing one house impacts the whole sequence
11. Pre-Construction Planning & Site Logistics
Pre-construction planning (months 0–1) determines feasibility and sets the tone for execution.
11.1 Pre-Construction Activities
textWeeks 1–2: Project initiation
- Kickoff meeting (GC, owner, key subs)
- Document project requirements, constraints, restrictions
- Identify critical success factors

Weeks 2–4: Baseline schedule development
- Create detailed WBS
- Estimate durations
- Establish dependencies
- Identify critical path
- Add contingency
- Get approvals

Weeks 3–6: Site logistics planning
- Visit site; document existing conditions
- Plan temporary facilities
- Plan access, egress, traffic management
- Plan material staging areas
- Plan waste management
- Plan utility locations

Weeks 4–8: Procurement planning
- Identify long-lead items (HVAC, elevators, custom components)
- Release RFQs
- Track supplier lead times
- Plan delivery schedules

Weeks 5–8: Safety & compliance planning
- Develop Safety Plan (OSHA-required on projects >$5M)
- Plan permits & inspections
- Plan environmental controls
- Plan quality assurance procedures

Weeks 6–8: Budget & cost planning
- Develop detailed cost estimate
- Establish cost control procedures
- Plan payment schedules
- Develop cash flow forecast
11.2 Site Logistics
Before work starts, plan:
- Temporary facilities
- Job trailers (office, break room, equipment storage, tool shed)
- Parking for workers (60 spots for 100 workers on typical project)
- Fueling stations for equipment
- Trash dumpsters (one 30-cubic-yard per 50 workers typical)
- Recycling containers (metals, wood, cardboard)
- Site access & egress
- Worker entrance/exit points
- Delivery/vendor access (separate from worker access when possible)
- Equipment access (cranes need clear paths)
- Traffic management (flag persons, gates, signs)
- Coordination with owner, tenants, adjacent businesses
- Crane placement & logistics
- Location (minimize off-loads, maximize reach)
- Hook height (what’s the tallest lift?)
- Radius (can reach entire job site?)
- Swing radius (are crane swings over adjacent properties OK?)
- Exclusive use area (no one under boom except during lifting)
- Material staging
- Delivery coordination (schedule arrivals; don’t choke site)
- Temporary storage areas (covered/uncovered, protected from weather)
- Material flow (minimize handling; get close to point of installation)
- Vertical transportation (use cranes; don’t hand-carry up scaffolding)
- Utility coordination
- Existing utilities: water, sewer, gas, electrical, telecommunications (locate before digging)
- Temporary utilities: power, water, dust suppression
- Utility shutoffs/isolations during construction
- Permits for temporary service
12. Material Procurement Scheduling Integration
Materials must arrive when needed—not too early (storage cost) or too late (delay).
12.1 Lead Time Management
Lead times vary dramatically by material:
textStandard items (lumber, concrete, fasteners): 1–2 weeks
Equipment (HVAC units, elevators): 8–16 weeks
Structural steel: 8–12 weeks (fabrication + delivery)
Custom millwork: 10–16 weeks
Specialty glazing: 10–14 weeks
Elevator: 12–20 weeks
Lead time example: Elevator
textMonth 1: Design complete; GC releases RFQ to three suppliers
Month 2: Suppliers quote; GC selects; PO issued
Month 2.5: Fabrication begins; long lead time order for motor
Month 4: Fabrication ~60% complete
Month 5: Fabrication complete; testing; delivery arranged
Month 6: Elevator arrives; installation begins

Total: 6 months from design freeze to installation start

If GC waits until Month 2.5 to order (thinking design not final), elevator doesn't arrive until
Month 7.5 → one month delay in project completion
Best practice:
- Order long-lead items before construction starts
- Even if some design details pending, order rough-in equipment immediately
- Build schedule assuming longest expected lead time; any earlier delivery is bonus
12.2 JIT (Just-in-Time) Delivery
Modern construction uses JIT: materials arrive exactly when needed.
Benefits:
- Reduces on-site storage costs
- Reduces material damage/theft
- Improves cash flow (pay supplier closer to when you use material)
- Keeps site less congested
Challenges:
- Supplier must be reliable (late deliveries become your problem)
- Requires excellent schedule communication
- Less buffer for variations
Typical JIT:
textDrywall hanging starts Monday
Drywall delivered Friday (3 days before use)
2–3 days buffer for unloading, inspection, organizing

If drywall schedule slips 1 week, delivery must be rescheduled
If truck doesn't show, crews stand idle → $2,000+/day cost
13. Schedule Risk Management & Contingency Planning
No schedule is perfect. Successful projects plan for uncertainty.
13.1 Identifying Schedule Risks
Common schedule risks:
- Weather: Rain, snow, wind, heat, cold
- Permits & approvals: Delayed permitting, design changes requiring re-approval
- Long-lead items: Supplier delays (fabrication, shipping)
- Labor availability: Crew not available when needed
- Site conditions: Subsurface surprises, utilities where not expected
- Coordination: Sequencing fails; activities not ready when predecessor finishes
- Testing & commissioning: Systems don’t work first time; rework required
- Changes & scope creep: Owner requests changes; design revisions
- Force majeure: Pandemic, natural disaster, war, strike
- Learning curve: New processes, new teams, unfamiliar work
13.2 Quantifying Risk Impact
textRisk: Weather delays (outdoor concrete work, winter region)

Probability: 60% chance of one weather delay
Impact: If occurs, lose 2–4 days

Expected impact: 60% × 3 days = 1.8 days contingency needed

Risk: HVAC units delivered late (12-week lead time, overseas supplier)

Probability: 30% chance of delay
Impact: If occurs, lose 2–3 weeks

Expected impact: 30% × 2.5 weeks = 0.75 weeks contingency needed

Total contingency: 1.8 + 7.5 = 9.3 days ≈ 2 weeks
13.3 Adding Contingency to Schedule
Bad approach:
textAdd 10% to every activity
Sum all durations
Add 10% to total

Result: Inflated schedule; team thinks they have buffer so works slower;
becomes self-fulfilling prophecy
Better approach:
text1. Calculate realistic critical path (no padding)
2. Identify high-risk activities
3. Add specific buffers only where needed
4. Place buffers at decision points (end of major phases)

Example:

Phase 1 (Foundation): 12 weeks
Risk buffers:
- Permit delays: +1 week
- Soil conditions: +1 week
- Weather: +0.5 week
Phase 1 contingency: 2.5 weeks
Phase 1 total: 14.5 weeks

Phase 2 (Structural): 16 weeks
Risk buffers:
- Steel delivery: +1 week
- Rework/inspection: +1 week
Phase 2 contingency: 2 weeks
Phase 2 total: 18 weeks

Phase 3 (MEP): 14 weeks
Risk buffers:
- Coordination: +1 week
Phase 3 contingency: 1 week
Phase 3 total: 15 weeks

Total schedule: 14.5 + 18 + 15 = 47.5 weeks (18% contingency vs. 10% blanket)
But contingency is allocated where risks actually exist.
14. Schedule Monitoring, Tracking & Updates
Baselined schedules don’t execute themselves. Active management is required.
14.1 Monthly Schedule Updates
Process:
textWeek 0: Collect actual data
- What activities actually started/finished last month?
- What's currently in progress?
- What % complete is each activity?

Week 1: Update schedule
- Remove completed activities
- Update % complete for in-progress activities
- Adjust remaining durations if needed
- Add any new activities discovered
- Recalculate critical path

Week 2: Analyze variances
- Schedule Variance (SV): Planned work vs. actual work
- Schedule Performance Index (SPI): How efficient are we?
- Forecast completion date: Based on SPI, when will we finish?
- Impact on cost: Schedule slips often trigger cost increases

Week 3: Report & communicate
- Present to owner, subcontractors, team
- Discuss variances, changes, risks
- Identify corrective actions if needed
- Baseline may need adjustment if significant changes occurred

Week 4: Implement corrective actions
- Accelerate critical path (add resources, work extended hours)
- Recover lost time (look for opportunities to parallelize)
- Replan recovery schedule if significantly behind
14.2 Schedule Performance Metrics
Schedule Variance (SV):
textSV = Earned Value - Planned Value
SV > 0: Ahead of schedule
SV < 0: Behind schedule
Schedule Performance Index (SPI):
textSPI = Earned Value ÷ Planned Value
SPI > 1: Ahead of schedule
SPI < 1: Behind schedule
SPI = 0.85: Only 85% as productive as planned; will need 15% more time

Example:
Planned 100 units by month 6
Actually completed 80 units by month 6
SPI = 80 ÷ 100 = 0.80

If this trend continues:
Planned completion month 12
Expected completion: 12 ÷ 0.80 = 15 months
Schedule will slip 3 months
15. Scheduling Tools & Software Comparison
15.1 Primavera P6 (Oracle)
Industry standard for large, complex projects ($100M+).
Capabilities:
- Unlimited activities, resources, costs
- Automatic CPM analysis
- Multi-project management
- Resource leveling
- Earned value tracking
- Portfolio management
- Advanced reporting
Cost: $2,500–$5,000/year per user
Learning curve: Steep (60+ hours of training)
Best for: Large contractors, owners, mega-projects, complex coordination
15.2 Microsoft Project
Widely used for mid-size projects ($1M–$100M).
Capabilities:
- Gantt charts, network diagrams
- Resource allocation & leveling
- Cost tracking
- Standard reporting
- Project Online (cloud version)
Cost: $10–$15/user/month
Learning curve: Moderate (20–30 hours)
Best for: Mid-size contractors, corporate PM, portfolio management
15.3 Smartsheet / Monday.com
Flexible, collaborative alternatives.
Capabilities:
- Gantt charts, task dependencies
- Resource tracking
- Collaboration tools (comments, attachments)
- Integration with Slack, Teams, etc.
- Mobile apps
Cost: $400–$1,500/month for teams
Learning curve: Easy (5–10 hours)
Best for: Agile/Lean projects, collaborative teams, smaller firms
15.4 Excel Spreadsheets
Manual but flexible for small projects.
Pros:
- Free
- Complete control
- Familiar interface
- No learning curve
Cons:
- No automatic CPM analysis
- Error-prone
- Manual updates tedious
- Hard to manage large schedules
Best for: Very small projects, quick planning, analysis tools
16. Common Scheduling Mistakes & Solutions
❌ Mistake 1: Unrealistic Durations
Problem: Activities estimated too optimistically (“best case”).
Result: Schedule aggressive from day 1; slip immediately.
Solution: Use PERT estimation; include learning curves; benchmark against past projects.
❌ Mistake 2: Poor Logic & Sequencing
Problem: Activities forced to be sequential that should be parallel.
Result: Inflated schedule; critical path extends unnecessarily.
Solution: Map workflow carefully; use SS relationships for parallel work; think through logic.
❌ Mistake 3: No Contingency
Problem: Baseline has zero buffer; “we’ll add time if delays happen.”
Result: First delay cascades; project immediately behind.
Solution: Baseline includes planned contingency (not wishful thinking); allocated where risks exist.
❌ Mistake 4: Outdated Schedule
Problem: Baseline created month 1; never updated with actual progress.
Result: Schedule becomes fiction; loses credibility; can’t forecast completion.
Solution: Update monthly; compare actual vs. plan; reforecast if significant variance.
❌ Mistake 5: Over-Detailed WBS
Problem: 5,000+ activities; impossible to manage; updates take forever.
Result: Schedule becomes burden; not updated; lost value.
Solution: 500–1,500 activities typical; summary level for reporting; detail level for management.
❌ Mistake 6: Forgetting Inspections & Approvals
Problem: Schedule shows work being done; doesn’t account for testing, inspections, rework.
Result: Activities take 40–50% longer than planned; inspections become bottleneck.
Solution: Include inspection, testing, commissioning, and rework activities explicitly.
17. Case Studies & Real-World Examples
Case Study 1: 50,000 sq ft Office Building (Initial 18-Month Schedule)
Project: Mid-rise office building; owner mandate: occupancy by specific date (regulatory requirement)
Baseline schedule:
textDemolition: 4 weeks
Site prep: 2 weeks
Foundation: 8 weeks
Structural frame: 12 weeks
MEP rough-in: 10 weeks (overlaps frame month 3–4)
Interior finish: 10 weeks (overlaps MEP month 2–3)
Testing & commissioning: 3 weeks
Closeout & occupancy: 2 weeks
TOTAL: 51 weeks (12.75 months) ✓ Meets owner requirement
What happened:
textMonth 2: Permit review extended (owner changed design scope)
Result: 4-week delay in permit approval

Month 3: Foundation excavation hit unforeseen contaminated soil
Result: 6-week delay for soil remediation + testing

Month 4: Structural steel supplier missed delivery (overseas fabrication)
Result: 3-week slip in steel erection start

Total delays: 4 + 6 + 3 = 13 weeks cumulative

Actual status at 6-month mark: 8 weeks behind schedule
Recovery plan:
textOption 1: Accept delay
- Consequence: Miss occupancy date; owner withholds final payment; potential claims

Option 2: Accelerate critical path
- Add second drywall crew (overlaps finish faster)
- Work weekends during finish phase (premium pay)
- Compress testing from 3 weeks to 2 weeks (accepts higher risk)
- Results: Recover 5 weeks

Option 3: Eliminate scope (not viable)
- Client won't accept reduced scope

Decision: Implement option 2 (acceleration + compressed testing)
Additional cost: +$400K (overtime premium, additional crew, expediting)
Result: Recover 5 of 13 weeks; 8-week slip unavoidable
Consequence: Project 8 weeks late = $640K liquidated damages (10% of contract value)
Net loss: $400K acceleration cost + $640K damages = $1.04M loss
Lessons:
- Build realistic contingency upfront (this project had almost none)
- Monitor schedule monthly (catch trends early; react quicker)
- Have recovery plan ready (don’t wait until crisis to figure out how to recover)
- Front-load risk items (order long-lead items, get permits, handle unknowns early)
Case Study 2: 500-Unit Residential Community (30-Month Master Plan)
Project: Master-planned community with multiple phases, different builders
Phased approach:
textPhase 1A (100 units): Months 0–12
Phase 1B (100 units): Months 6–18 (overlaps 1A)
Phase 2A (150 units): Months 12–24 (overlaps 1B)
Phase 2B (150 units): Months 18–30 (overlaps 2A)
Amenities (pool, clubhouse, roads): Months 0–30 (throughout)
Lean/Takt planning approach:
textStandardized designs: 4 unit types (A, B, C, D)
Takt time: 1 complete unit per day per builder
Steady crews: Each builder maintains crew for 30 months (no layoffs/rehiring)
Material JIT: Components delivered 1 day before use
Sequence: All Phase 1A units → Phase 1B → Phase 2A → Phase 2B
Each unit type manufactured at same location; minimizes learning curve
Results:
textSchedule adherence: 99% (better than typical ±10%)
Cost performance: 15% under budget vs. traditional phased approach
Crew retention: 98% (same crews for 30 months; high quality)
Rework: <1% (familiarity + standardization)
Safety: 0.5 TRIR (excellent; familiar work = safe work)
Key success factors:
- Standardization: 4 designs, not 50 unique designs
- Dedicated crews: Same builders, same phases, predictable work
- Long-term planning: 30-month visibility; suppliers knew steady demand
- Process discipline: Everyone follows the takt; don’t deviate
- Quality of process: Investment in planning paid dividends in execution
18. FAQ
Q: How often should I update the schedule?
A: Minimum monthly (standard practice). Weekly during active phases. As soon as significant changes occur (permit issue, material delay, scope change).
Q: What’s a reasonable contingency percentage?
A: 5–15% of total duration depending on risk.
- Detailed projects, known scope, experienced team: 5–8%
- Complex projects, new team, weather-heavy: 12–15%
- Mega-projects, multiple unknowns, novel: 15–20%
Q: Should I share the detailed schedule with subcontractors?
A: Yes, selectively. Share their specific activities, 2 weeks before/after their work. Don’t share competitive information or your strategy for claiming against others’ delays.
Q: Can I compress a schedule without additional cost?
A: Rarely. Compression strategies cost money:
- Adding crews: +5–15% labor cost per week compressed
- Working extended hours: +20–50% labor cost (fatigue, premium pay)
- Working weekends: +50–100% labor cost (premium pay + coordination overhead)
- Fast-tracking: +10–20% (more rework due to overlap)
Q: What if I’m behind schedule? How do I recover?
A: Time Impact Analysis (TIA):
- Identify root cause (your fault vs. external)
- Calculate impact on critical path (is it really a delay?)
- Develop recovery plan (accelerate, overlap, reduce scope)
- Communicate to owner (update schedule, forecast new completion)
- Update contract (change order for acceleration costs if not your fault)
Q: How detailed should my schedule be?
A: Activities should be 2–5 days duration (level of detail needed to manage).
- Too detailed (0.5-day activities): Unmanageable; updates tedious
- Too coarse (2-week activities): Can’t see problems until too late
- Sweet spot: 2–5 days; detailed enough to manage; coarse enough to stay current
19. Conclusion
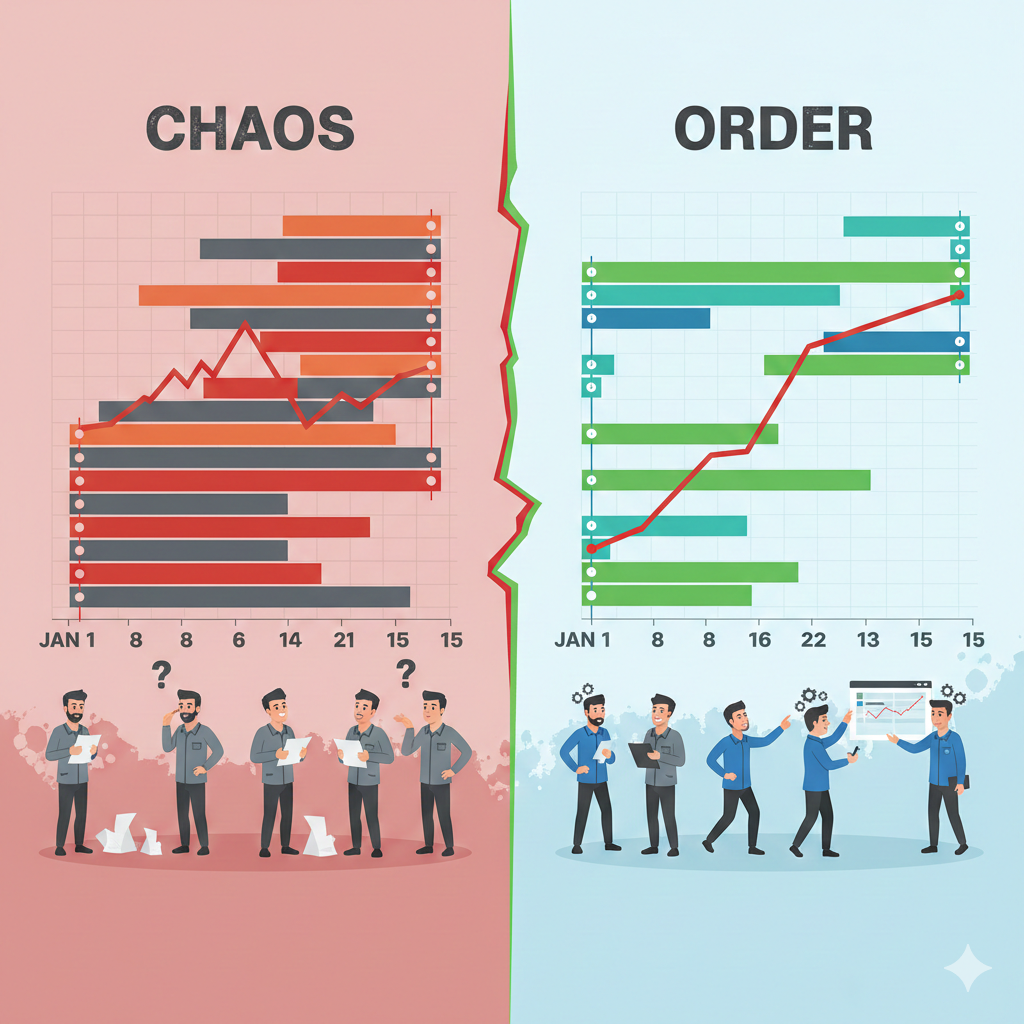
Planning and scheduling are the cornerstones of construction project management. They transform chaos into order; unknowns into managed risks; hopes into reality.
A well-developed schedule:
✅ Protects your profits: Controls costs through visibility and coordination
✅ Manages risk: Identifies threats early; enables proactive mitigation
✅ Coordinates teams: Everyone knows when they’re needed; reduces conflicts
✅ Enables claims: Proves impact of delays (critical path analysis)
✅ Forecasts completion: Realistic estimate of when project finishes
✅ Supports decisions: Provides data for “what-if” analysis
The fundamentals are timeless:
- Break work into manageable pieces (2–5 day activities)
- Estimate realistically (PERT, historical data, experienced judgment)
- Link logically (proper dependencies; parallel work where possible)
- Assign resources (explicit labor, equipment, material)
- Identify critical path (what controls the schedule?)
- Add contingency (where risks exist, not everywhere)
- Update monthly (compare actual vs. plan)
- Reforecast (if significant variance, update completion date)
- Communicate (everyone understands the plan and their role)
- Control (take corrective action when needed)
Whether you use Primavera, MS Project, Smartsheet, or Excel, the principles remain constant. The tool is secondary; the discipline of scheduling is primary.
Invest in planning; reap the rewards in execution.
Free Resources Available
Download our exclusive Famcod PM Resources:
- CPM Schedule Template (Excel + Primavera)
- Schedule Risk Assessment Checklist
- Resource Leveling Worksheet
- Gantt Chart Template
- Schedule Update Procedures
- Contingency Planning Guide
Sign up for our email list for instant access + weekly PM tips.
Related Articles on Famcod
Recommended Books & Courses
Books:
Courses: