Introduction
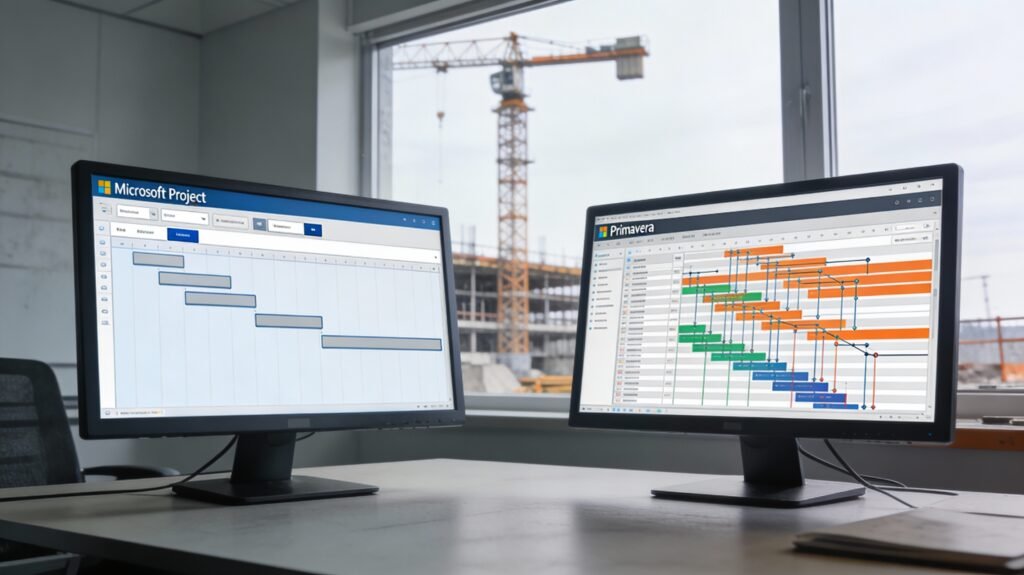
Microsoft Project and Primavera P6 lead as top tools, but key differences in handling complex timelines make one better for specific needs. In 2026, with construction management software market hitting $10.64 billion, choosing between Microsoft Project vs Primavera affects efficiency.
This guide breaks down Microsoft Project vs Primavera key differences, focusing on construction. Teams using Primavera report 20% better resource optimization in large builds, while Microsoft Project suits smaller sites with its intuitive interface. Expect tables, checklists, formulas, and case studies to implement immediately.
Why This Matters in Construction
Delays plague 70% of construction projects, averaging 20% over budget. Microsoft Project vs Primavera: key differences emerge in scalability—Primavera handles 100,000+ activities for megaprojects like highways, while Microsoft Project excels in mid-sized residential jobs.
In construction, Primavera’s unlimited baselines track changes better than Microsoft Project’s 11-baseline limit, reducing rework by 15%.
Market data shows Primavera dominating enterprise construction at 38% share in scheduling apps. Your choice impacts timelines: Primavera cut one project’s duration from 933 to 739 days.
Table of Contents
1. Why Microsoft Project Matters in Construction
1.1 Construction Is Time-Driven, Not Just Cost-Driven
In construction, time directly converts to money:
- Extended preliminaries
- Equipment idle costs
- Labor inefficiencies
- Liquidated damages (LDs)
The relationship can be expressed as:Time Overrun Cost=Daily Overhead Cost×Delay Days
MS Project allows planners to visualize time impacts before execution, reducing surprises on site.
1.2 Contractual Importance of Schedules
In most construction contracts (FIDIC, EPC, Design-Build):
- The approved baseline schedule becomes a contractual document
- Delays are measured against the MS Project schedule
- Extension of Time (EOT) claims depend on logic-linked schedules
Without a properly structured MS Project file, claims become opinions instead of evidence.
1.3 Why MS Project Is Preferred on Site
Compared to complex tools, MS Project:
- Has a shorter learning curve
- Integrates with Excel, Power BI, and ERP systems
- Is accepted by consultants and clients globally
- Works well for small to mid-size construction projects
2. Microsoft Project vs Other Construction Scheduling Tools
2.1 Comparison Table: MS Project vs Primavera P6 vs Excel
| Feature | Microsoft Project | Primavera P6 | Excel |
|---|---|---|---|
| Learning Curve | Low–Medium | High | Low |
| CPM Logic | Strong | Very Strong | Weak |
| Resource Loading | Good | Excellent | Manual |
| Cost Control | Moderate | Advanced | Manual |
| Claim Support | Good | Excellent | Poor |
| Best For | Small–Mid Projects | Mega Projects | Simple Planning |
Practical Insight:
For projects under ₹500–700 Cr, Microsoft Project is often sufficient when structured properly.
2.2 When MS Project Is the Right Choice
Use Microsoft Project when:
- The project duration is 6–36 months
- Team members are not full-time planners
- Client requires simple, transparent schedules
- Cost control is done in Excel or ERP
3. Core Construction Scheduling Concepts
3.1 What a Construction Schedule Actually Represents
A construction schedule is not just dates. It represents:
- Construction sequence
- Resource flow
- Cash flow timing
- Risk exposure
3.2 Key Terms Every Construction Planner Must Know
- Activity – A measurable construction task
- Milestone – Zero-duration contract event
- Float – Allowable delay without project impact
- Critical Activity – Zero float task
3.3 Schedule Quality Metrics
A good MS Project schedule should have:
- Less than 5% open-ended activities
- Logical predecessors for all tasks
- Realistic durations based on productivity
4. Construction Work Breakdown Structure (WBS)
4.1 What Is WBS in Construction?
A Work Breakdown Structure divides the project into manageable parts:
- Location-based
- Trade-based
- Phase-based
Example:
1. Substructure
   1.1 Excavation
   1.2 PCC
   1.3 Footings
2. Superstructure
   2.1 Columns
   2.2 Beams
   2.3 Slabs
4.2 WBS Best Practices
Checklist: Effective Construction WBS
- Match BOQ structure
- Align with billing stages
- Reflect site execution sequence
- Avoid excessive fragmentation
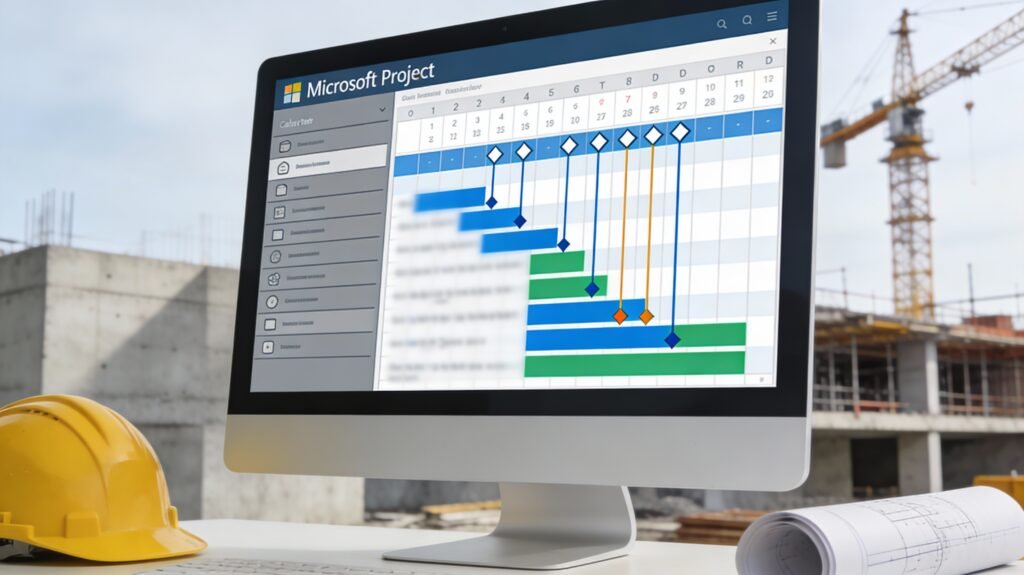
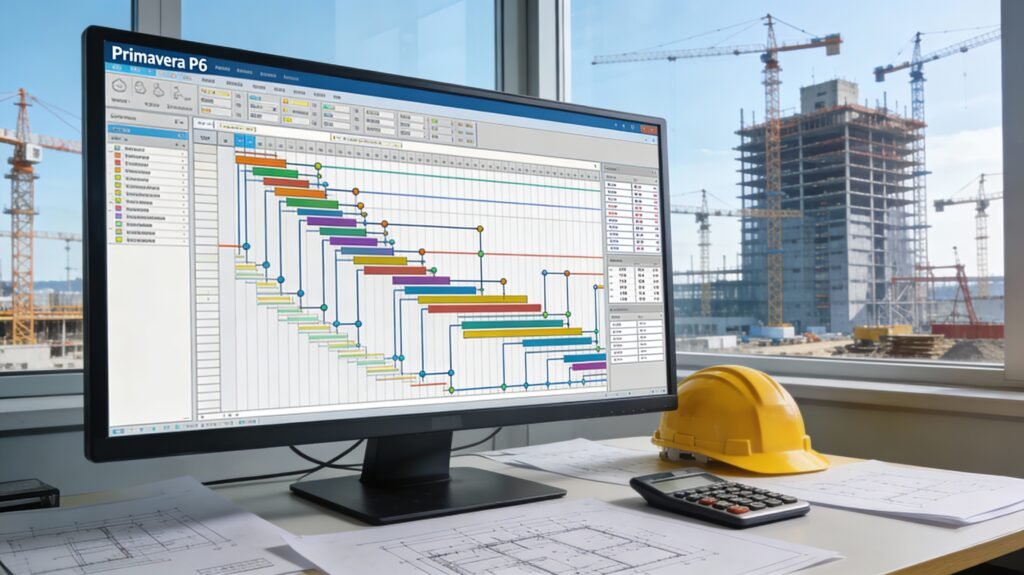
5. Microsoft Project Interface Explained for Construction Users
5.1 Key Views You Must Master
- Gantt Chart
- Network Diagram
- Task Usage
- Resource Sheet
- Tracking Gantt
5.2 Columns Every Construction Schedule Should Include
- Task Name
- Duration
- Start / Finish
- Predecessors
- Total Float
- % Complete
6. Setting Up a Construction Project in MS Project (Step-by-Step)
6.1 Step 1: Project Information Setup
- Set project start date
- Define calendar
- Confirm working hours
6.2 Step 2: Create WBS
- Enter summary tasks
- Add activities under each trade
- Indent properly
6.3 Step 3: Define Durations
Worked Example: Slab Concreting Duration
Given:
- Area = 800 m²
- Productivity = 80 m²/day
Duration=80800=10 days
Enter 10d in MS Project.
7. Calendars, Shifts & Construction Constraints
7.1 Why Construction Calendars Matter
Ignoring calendars causes:
- Unrealistic completion dates
- Incorrect float values
7.2 Common Construction Calendars
- General Shift (6 days/week)
- Concrete Works Calendar
- Night Shift Calendar
7.3 Checklist: Calendar Setup
- Define weekly offs
- Add monsoon/non-working days
- Assign calendars to tasks (not only project)
8. Task Types, Durations & Construction Logic
8.1 Fixed Duration vs Fixed Work
- Fixed Duration – Preferred for construction
- Fixed Work – Used for manpower-driven tasks
8.2 Common Construction Durations
- Excavation: Productivity-based
- Concrete: Pour cycle-based
- Finishing: Area-based
9. Dependencies & Network Logic
9.1 Four Dependency Types
- Finish to Start (FS) – Most common
- Start to Start (SS) – Parallel works
- Finish to Finish (FF) – Testing & commissioning
- Start to Finish (SF) – Rare in construction
9.2 Lag & Lead Usage
Example:
- Slab curing starts 2 days after concreting
- Use FS + 2d lag
10. Critical Path Method (CPM) in Construction
10.1 What Is the Critical Path?
The longest path with zero float determines project duration.
10.2 Why CPM Matters on Site
- Focus supervision on critical works
- Prioritize resources
- Evaluate delay impact
11. Baselines & Control Philosophy
11.1 Why Baselines Are Mandatory
Without a baseline:
- No delay measurement
- No performance analysis
11.2 Baseline Checklist
- Client-approved schedule
- Resource-loaded
- Logic-checked
12. Common Beginner Mistakes in MS Project
| Mistake | Solution |
|---|---|
| No predecessors | Link all tasks logically |
| Excessive constraints | Use relationships, not constraints |
| Unrealistic durations | Use productivity data |
| No baseline | Always save baseline |
| Manual % complete | Use physical progress |
13. Mini Case Study: Residential Building Planning
Project: G+12 Residential Tower
Duration: 18 months
Tool: Microsoft Project
Outcome:
- Optimized slab cycle from 14 → 10 days
- Identified critical path in superstructure
- Reduced projected delay by 22%
14. Free Learning Resources
- Microsoft official templates
- Famcod construction planning guides
- Sample MS Project files (construction-specific)
15. Key Takeaways
- Microsoft Project remains a powerful construction planning tool
- Proper WBS and logic define schedule quality
- Calendars and CPM are non-negotiable
- Poor setup leads to poor control
1. Transitioning from Planning to Control
1.1 Why Planning Alone Fails in Construction
A beautifully prepared schedule that is not updated is useless. Industry data indicates that over 60% of project delays are not detected early enough because schedules are treated as static documents [2].
Microsoft Project becomes truly powerful after construction starts, when it is used for:
- Progress measurement
- Forecasting completion dates
- Identifying productivity losses
- Supporting contractual claims
1.2 Control Cycle in Construction Scheduling
A standard control cycle looks like this:
- Baseline approved
- Site progress collected
- Schedule updated
- Variances analyzed
- Corrective actions planned
This cycle repeats weekly or monthly throughout the project.
2. Resource Management in Construction Projects
2.1 What Are Resources in Construction?
In MS Project, construction resources typically include:
- Labor (masons, carpenters, electricians)
- Equipment (cranes, excavators, batching plants)
- Materials (concrete, steel – optional tracking)
2.2 Why Resource Management Matters
Poor resource planning leads to:
- Idle labor costs
- Equipment underutilization
- Site congestion
- Productivity loss
Construction Reality:
Increasing manpower does not always reduce duration due to space and sequencing constraints.
3. Resource Loading in Microsoft Project (Step-by-Step)
3.1 Step 1: Create Resource Sheet
Open Resource Sheet view and define:
- Resource Name
- Type (Work / Material)
- Max Units
- Standard Rate
Example:
Mason – Work – 100% – ₹850/day
Tower Crane – Work – 100% – ₹45,000/day
3.2 Step 2: Assign Resources to Activities
- Select activity
- Assign labor/equipment
- Verify units
3.3 Worked Example: Mason Requirement Calculation
Task: Brickwork – 1,200 m²
Productivity: 12 m²/day/masonMasons Required=12×251200=4 masons
Enter 400% units for Mason resource.
3.4 Resource Usage View
Use Task Usage view to:
- Verify daily manpower
- Detect spikes
- Optimize deployment
4. Resource Leveling Techniques for Construction
4.1 What Is Resource Leveling?
Resource leveling adjusts activity dates to:
- Remove over-allocation
- Balance manpower
- Avoid peaks
4.2 Leveling Options Explained
| Option | Construction Recommendation |
|---|---|
| Automatic leveling | ❌ Avoid |
| Manual leveling | ✅ Preferred |
| Level only within float | ✅ Best practice |
4.3 Step-by-Step: Manual Resource Leveling
Checklist:
- Identify over-allocated resource
- Review float of activities
- Delay non-critical tasks
- Maintain critical path logic
5. Cost Management Fundamentals in MS Project
5.1 Types of Construction Costs
- Direct costs – labor, materials, equipment
- Indirect costs – site overheads
- Time-related costs – preliminaries
5.2 Cost Formula in MS Project
MS Project calculates task cost as:Task Cost=Work×Rate+Fixed Cost
This aligns well with construction BOQs.
6. Cost Loading Construction Schedules
6.1 Why Cost-Loaded Schedules Matter
Cost-loaded schedules help:
- Forecast cash flow
- Monitor budget vs progress
- Support interim payment claims
6.2 Step-by-Step: Cost Loading
- Assign rates to resources
- Add fixed costs to tasks
- Verify cumulative cost curve
- Save baseline
6.3 Comparison: Time-Only vs Cost-Loaded Schedule
| Aspect | Time-Only | Cost-Loaded |
|---|---|---|
| Progress visibility | Low | High |
| Cash flow forecasting | ❌ | ✅ |
| Claim strength | Weak | Strong |
7. Earned Value Management (EVM) for Construction
7.1 Key EVM Metrics Explained Simply
- Planned Value (PV) – Budgeted work
- Earned Value (EV) – Completed work
- Actual Cost (AC) – Spent amount
7.2 Critical Construction Indices
SPI=PVEVCPI=ACEV
- SPI < 1 → behind schedule
- CPI < 1 → over budget
7.3 Worked Example: EVM Calculation
- PV = ₹10 Cr
- EV = ₹8.5 Cr
- AC = ₹9.2 Cr
SPI=0.85CPI=0.92
Interpretation: Project is both delayed and over budget.
8. Progress Tracking & Updating Schedules
8.1 Progress Measurement Methods
- % Complete
- Physical quantity-based
- Milestone-based
Best Practice: Use physical progress, not subjective percentages.
8.2 Step-by-Step Monthly Update
Checklist:
- Freeze data date
- Update actual start/finish
- Update remaining duration
- Recalculate critical path
- Analyze variance
9. Delay Analysis & Recovery Planning
9.1 Identifying Delay Causes
Common delay sources:
- Late drawings
- Resource shortages
- Weather impacts
- Client changes
9.2 Recovery Techniques
- Resequencing activities
- Parallel execution (SS links)
- Additional shifts
- Resource augmentation
9.3 Float Consumption Tracking
MS Project allows tracking:
- Total float erosion
- Critical path shifts
- Near-critical paths
10. Claims Support Using Microsoft Project
10.1 Why MS Project Is a Claims Tool
Well-maintained schedules provide:
- Cause-effect linkage
- Time impact analysis
- Evidence-based EOT claims
10.2 Typical Claim Scenarios
- Delay due to late approvals
- Scope change impact
- Force majeure events
11. Advanced Scheduling Best Practices
11.1 Schedule Quality Checklist
- No open-ended tasks
- Logical relationships only
- Limited constraints
- Updated monthly
11.2 Integration with Other Tools
- Excel (quantity tracking)
- Power BI (dashboards)
- ERP (cost data)
12. Common Advanced Mistakes & Solutions
| Mistake | Impact | Solution |
|---|---|---|
| Excessive leads | Logic distortion | Use minimal leads |
| Auto-leveling | Schedule instability | Manual leveling |
| Updating baseline | Claim failure | Never overwrite baseline |
| Ignoring near-critical path | Hidden delays | Monitor float |
13. Case Study 1: High-Rise Residential Tower
Project: G+25 Residential
Duration: 30 months
Value: ₹420 Cr
MS Project Application:
- Resource-loaded schedule
- Monthly EVM tracking
- Critical path re-optimization
Result:
- 18% manpower optimization
- 45 days delay recovered
- CPI improved from 0.88 → 0.97
14. Case Study 2: Industrial Warehouse Project
Project: 1.2 million sq.ft warehouse
Duration: 14 months
Challenges:
- Steel procurement delays
- Monsoon impact
Solution Using MS Project:
- Alternate sequencing
- Parallel roofing & flooring
- Shift-based planning
Outcome:
- Zero LDs
- Project delivered within revised baseline
2. Why Primavera P6 Matters in Construction
2.1 Complexity of Modern Construction Projects
Modern construction projects involve:
- 5,000–100,000+ activities
- Multiple stakeholders and interfaces
- Long durations (2–10 years)
- High financial exposure
Studies show that over 70% of large construction projects face schedule delays [1]. Primavera P6 directly addresses this risk by enabling proactive planning and control.
2.2 Contractual & Legal Importance
Primavera schedules are widely accepted for:
- Baseline approvals
- Monthly progress reporting
- Delay analysis & claims
- Arbitration and dispute resolution
Many FIDIC and EPC contracts explicitly require CPM schedules developed in Primavera P6.
2.3 Data-Driven Decision Making
Primavera allows teams to:
- Forecast completion dates
- Identify critical & near-critical paths
- Analyze resource bottlenecks
- Track cost vs progress
This transforms project management from reactive firefighting to predictive control.
2.4 Industry Adoption
Primavera P6 is used by:
- Government infrastructure agencies
- Oil & gas majors
- Top EPC contractors
- Multinational construction firms
Learning Primavera significantly improves employability and project outcomes.
3. Fundamental Concepts of Primavera P6
3.1 Enterprise Project Structure (EPS)
EPS defines how projects are organized within Primavera.
Example:
Company EPS
 ├── Infrastructure Division
 │   ├── Metro Rail Project
 │   └── Highway Project
 └── Buildings Division
     ├── Hospital Project
     └── Commercial Tower
EPS ensures portfolio-level control and reporting.
3.2 Organizational Breakdown Structure (OBS)
OBS defines who controls what.
- Project Manager
- Planning Manager
- Site Engineers
OBS links authority and responsibility to projects.
3.3 Calendars
Calendars define:
- Working days
- Holidays
- Shifts
Example:
- 6 days/week
- 10 hours/day
Calendars directly affect activity durations and project finish dates.
3.4 Critical Path Method (CPM)
Primavera uses CPM to calculate:
- Early Start (ES)
- Early Finish (EF)
- Late Start (LS)
- Late Finish (LF)
Total Float Formula:Total Float=LS−ES=LF−EF
Activities with zero float form the Critical Path.
4. Primavera P6 Project Lifecycle Explained
4.1 Project Creation
Key steps:
- Create EPS node
- Define project ID & dates
- Assign calendars
4.2 Planning & Baseline Development
Planning includes:
- WBS creation
- Activity listing
- Logic linking
- Resource loading
The approved plan becomes the Baseline Schedule.
4.3 Execution & Updating
Monthly updates involve:
- Actual start/finish
- Remaining duration
- % complete
4.4 Monitoring & Control
Primavera tracks:
- Schedule variance
- Cost variance
- Forecast completion
5. Work Breakdown Structure (WBS) in Primavera
5.1 Purpose of WBS
WBS breaks the project into manageable sections.
Example:
- Project
- Civil Works
- Structural Works
- MEP Works
5.2 Best Practices for Construction WBS
Checklist:
- Align with BOQ
- Reflect construction sequence
- Avoid excessive depth
- Enable progress measurement
5.3 WBS vs Activities
| Aspect | WBS | Activities |
|---|---|---|
| Purpose | Organize | Execute |
| Duration | No | Yes |
| Resources | No | Yes |
6. Activity Definition, Relationships & Logic
6.1 Activity Types
- Task Dependent
- Resource Dependent
- Milestone (Start / Finish)
6.2 Relationships
Primavera supports:
- Finish-to-Start (FS)
- Start-to-Start (SS)
- Finish-to-Finish (FF)
- Start-to-Finish (SF)
Construction Tip:
Use FS for structural works, SS for parallel activities.
6.3 Logic Quality Checklist
- No open ends
- Minimal lags
- Realistic sequencing
7. Scheduling Techniques & CPM in Primavera
7.1 Forward & Backward Pass
Forward pass calculates early dates.
Backward pass calculates late dates.
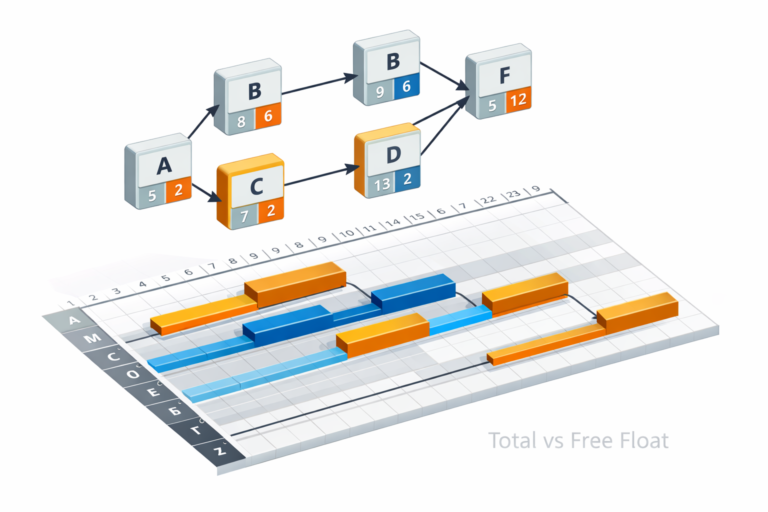
7.2 Float Analysis
Types of float:
- Total Float
- Free Float
Negative float indicates delay risk.
7.3 Worked Example (CPM Calculation)
Activity Data:
| Activity | Duration | Predecessor |
|---|---|---|
| A | 5 | – |
| B | 4 | A |
| C | 6 | A |
| D | 3 | B, C |
Critical Path = A → C → D
Total Duration = 14 days
8. Resource Loading, Cost Control & EVM
8.1 Resource Types
- Labor
- Equipment
- Materials
8.2 Resource Loading Formula
Resource Units=Duration×Units/Day
8.3 Earned Value Management (EVM)
Key formulas:CPI=ACEVSPI=PVEV
Where:
- EV = Earned Value
- AC = Actual Cost
- PV = Planned Value
Interpretation:
- CPI < 1 → Cost overrun
- SPI < 1 → Schedule delay
9. Baselines, Updates & Progress Measurement
9.1 Baseline Types
- Original Baseline
- Revised Baseline
9.2 Updating Checklist
Monthly update steps:
- Fix data date
- Update actuals
- Recalculate schedule
- Compare with baseline
9.3 Progress Curves
- Planned vs Actual
- S-curves for management reporting
10. Advanced Primavera Applications
10.1 Delay Analysis Techniques
- Impacted As-Planned
- Time Impact Analysis (TIA)
- As-Built vs As-Planned
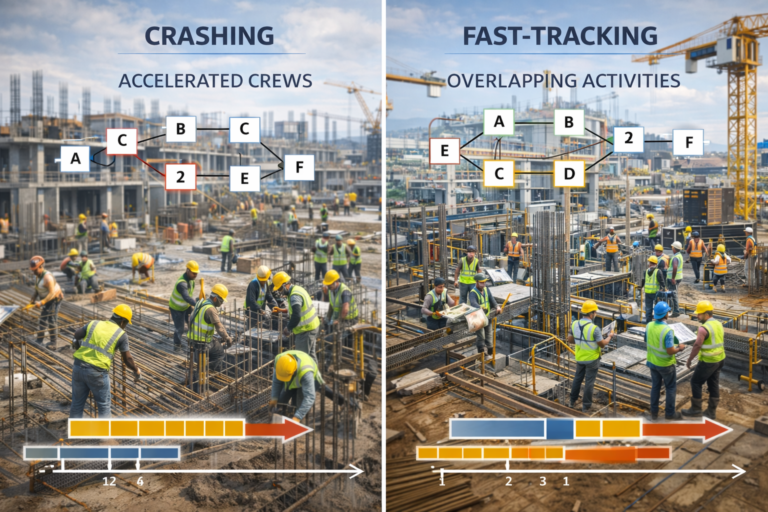
10.2 What-If Scenarios
Primavera allows:
- Resource optimization
- Fast-tracking simulations
10.3 Multi-Project Control
Portfolio dashboards help senior management track:
- KPIs
- Cash flow
- Resource utilization
11. Primavera Tools, Software & Integrations
11.1 Primavera P6 Professional vs EPPM
| Feature | P6 Pro | EPPM |
|---|---|---|
| Desktop | Yes | No |
| Web-based | No | Yes |
| Collaboration | Limited | High |
11.2 Integration Tools
- Excel
- Power BI
- Oracle Unifier
12. Common Mistakes & Solutions
Mistake 1: Poor WBS Structure
Solution: Align WBS with BOQ & execution plan
Mistake 2: Excessive Constraints
Solution: Let logic drive dates
Mistake 3: Missing Baseline
Solution: Always approve baseline before execution
Mistake 4: Incorrect Progress %
Solution: Use physical % complete
Mistake 5: Ignoring Near-Critical Path
Solution: Monitor float trends monthly
13. Real-World Case Studies
Case Study 1: High-Rise Building Project
- Duration: 36 months
- Activities: 8,200
- Delay reduced by 4 months using resource leveling
Case Study 2: Highway Infrastructure Project
- Length: 120 km
- Primavera used for EOT claim
- Approved delay: 210 days
Case Study 3: Oil & Gas EPC Project
- Budget: $450 million
- CPI improved from 0.89 to 1.03
- Savings: $18 million
14. Frequently Asked Questions (FAQs)
Q1. Is Primavera P6 hard to learn?
No. With structured training and real projects, planners become productive within 2–3 months.
Q2. Is Primavera better than MS Project?
For large construction projects, yes—Primavera handles scale, complexity, and claims better.
Q3. Do site engineers need Primavera?
Yes. Understanding schedules improves site coordination and productivity.
Q4. What industries use Primavera?
Construction, oil & gas, power, infrastructure, EPC, manufacturing shutdowns.
Q5. Can Primavera handle cost control?
Yes, with resource and cost loading plus EVM.
Q6. Is Primavera mandatory for claims?
In most EPC and infrastructure projects, yes.
Conclusion
Microsoft Project vs Primavera key differences boil to scale: Microsoft for intuitive small-mid construction (e.g., residential under 100 tasks), Primavera for enterprise giants with unlimited baselines, risk tools, and 20% resource savings. Use checklists for scheduling, CPM formulas for paths, tables for comparisons.
Implement today: Audit your project size—switch to Primavera if >500 activities. Explore Famcod resources for deeper dives. Download free templates via links below.
Related Articles
- Critical Path Method (CPM) Guide for Construction 2026
- Dependency Types in Construction Scheduling (FS, SS, FF, SF) Explained: Complete Guide 2026
- Float Calculation Methods: Total Float vs Free Float in Construction Scheduling
- Schedule Compression Techniques in Construction: Crashing vs Fast-Tracking Explained
- Resource Allocation Strategies in Planning for Construction Projects
Recommended Resources


“Microsoft Project 2025 For Dummies” – Beginner construction focus.

Coursera: “Primavera P6 Project Planning” – Master scheduling. Coursera.
Coursera: “Google Project Management” – MS Project basics. Coursera.
Udemy: Primavera P6 Masterclass – PDUs included. Udemy.
Free Resources Available
Download Famcod templates: CPM calculator Excel, WBS samples, leveling checklists. Sign up for weekly construction PM tips. Access via Famcod Free Tools.