Visual illustration of activity duration estimating techniques applied in construction planning and scheduling.
1. Introduction to Activity Duration Estimating
Activity duration estimating is the foundation of every construction schedule. Without accurate duration estimates, even the most sophisticated Critical Path Method (CPM) analysis, resource leveling, and risk mitigation efforts fail. The schedule becomes unrealistic, stakeholders lose confidence, and the project descends into chaos.
In construction, duration estimates determine everything:
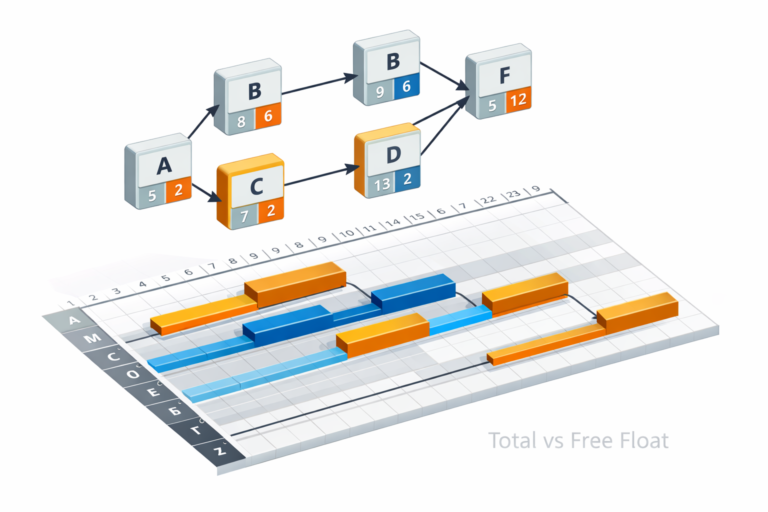
- Critical path identification: Which activities control project completion
- Resource allocation: How many crews, how long on site
- Cash flow forecasting: When work completes, when billing occurs
- Risk assessment: Where buffers are needed
- Claims substantiation: Proving delays impacted schedule
Table of Contents
Poor duration estimates cause 90% of schedule variances in construction projects. Consider these real-world consequences:
- Labor costs: 12-day activity estimated at 10 days with 15 workers = $30K overrun
- Equipment rentals: Crane rental for 6 weeks planned, activity extends to 8 weeks = $50K extra
- Material waste: Materials ordered for 4-week phase sit unused for 2 weeks = $15K storage/handling
- Claims exposure: Contractor claims owner delay impacted critical path, but unrealistic baseline discredits claim
This comprehensive guide covers all major activity duration estimating techniques used in construction—from basic analogous methods to sophisticated PERT analysis. You’ll learn practical formulas, productivity benchmarks, real-world examples, and common pitfalls to avoid. Whether managing a $1M renovation or $100M infrastructure project, these techniques ensure your schedules reflect reality, not wishful thinking.
Ready to master construction project management?
Enroll in Coursera: “Project Management in Construction Specialization” by Columbia University. Covers scheduling, cost control, risk management, and execution for real-world projects.
Start Coursera Course Now
2. Why Accurate Duration Estimating Matters in Construction
2.1 Schedule Integrity & Critical Path
Duration estimates define the critical path—the sequence of activities that determines project completion. Underestimate by 20%, and your 12-month project becomes 14.4 months. Overestimate by 20%, and you lose competitive bids.
Example impact:
textOffice building project (120,000 sq ft):
- Framing estimated 8 weeks → actual 12 weeks (50% underestimate)
- Critical path delay: 4 weeks
- Total project slip: 4 weeks
- Cost: $2,500/day × 20 days = $50K liquidated damages
- Plus: Extended overhead, equipment, supervision costs
2.2 Resource Planning & Cost Control
Duration directly drives resource needs:
textDrywall activity:
Scenario 1: 10 days × 4 workers = 320 labor hours
Scenario 2: 15 days × 4 workers = 480 labor hours (+50% cost)

Same scope, different duration → dramatically different costs
Industry data: Labor costs represent 40-60% of total construction costs. Inaccurate duration estimates create massive cost variances.
2.3 Cash Flow & Financing
Construction companies live on progress payments tied to schedule milestones. Slip the schedule, slip the cash:
textMonth 3 milestone: $2.5M billing planned
Actual completion: Week 4 of month 4
Cash shortfall: $2.5M × 4 weeks × 10% carrying cost = $100K lost
Banks monitor schedule performance for construction loans. Slipping milestones triggers covenant violations, increased interest rates, or loan calls.
2.4 Claims & Dispute Resolution
Your baseline schedule becomes evidence in delay claims. Unrealistic durations undermine credibility:
textContractor claims: "Owner's RFI delayed steel delivery 3 weeks"
Owner defense: "Your baseline showed 6 weeks for steel, not 3 weeks"
Result: Claim denied due to unrealistic baseline
Forensic schedule analysis (used in 70% of construction disputes over $5M) relies on credible duration estimates as the foundation.
2.5 Stakeholder Confidence & Project Success
Unrealistic schedules erode trust:
- Owner: “This contractor doesn’t understand the work”
- Subcontractors: “Schedule meaningless; we’ll work when we can”
- Team: “Impossible targets; no one tries”
Realistic schedules build momentum:
- Small wins create confidence
- Team focuses on achievable goals
- Stakeholders celebrate milestones together
3. Fundamental Concepts of Duration Estimation
3.1 What Constitutes “Duration”?
Activity duration includes all time from start to finish, not just productive work hours:
textFraming activity (12 days total):
Day 1: Mobilization, layout (4 hours productive)
Day 2: Material delays (2 hours productive)
Day 3-10: Full productivity (8 hours/day)
Day 11: Weather delay (4 hours productive)
Day 12: Demobilization, cleanup (2 hours productive)

Total labor hours: 68 hours
Calendar duration: 12 days
Productivity factor: 68 ÷ (12 × 8) = 71%
Key concept: Calendar duration ≠ labor hours. Always estimate calendar time.
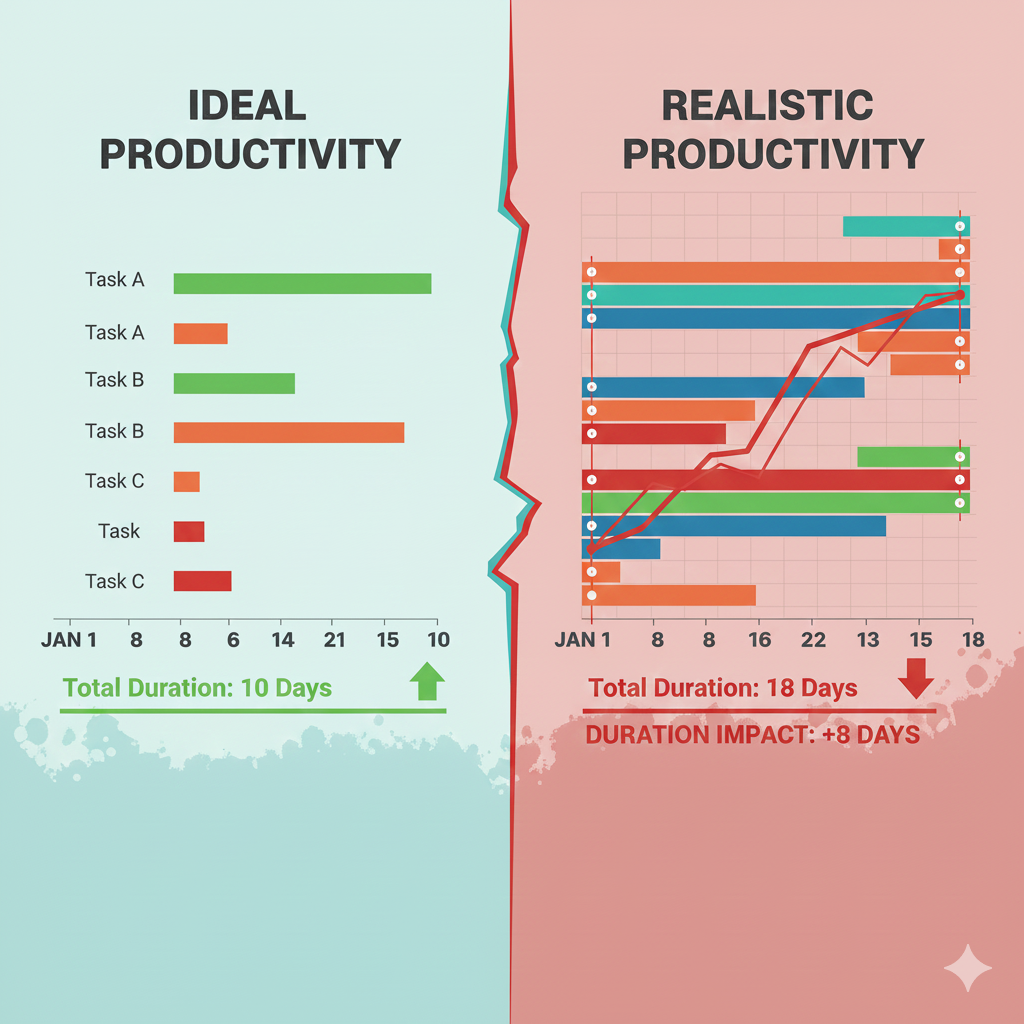
3.2 Productivity Factors
Productivity varies dramatically based on conditions:
textDrywall hanging (ideal vs. real conditions):

Ideal conditions: 1,500 sq ft/day/crew
- Open space, good access, pre-cut materials

Real conditions: 800 sq ft/day/crew
- Mechanical conflicts, tight access, field cutting

Productivity adjustment: 800 ÷ 1,500 = 53%
Duration doubles when using ideal rates
Standard productivity factors:
- Congested site: 70-85% of ideal
- Weather (rain/cold): 60-80% of ideal
- Overtime fatigue: 80-90% of ideal
- Learning curve (first week): 70-85% of steady state
- Night shift: 75-85% of day shift
3.3 Crew Balance & Gang Size
Productivity isn’t linear with crew size:
textConcrete crew productivity:

1 crew (4 workers): 12 cubic yards/day
2 crews (8 workers): 22 cubic yards/day (not 24)
3 crews (12 workers): 28 cubic yards/day (not 36)

Why? Supervision overhead, material handling bottlenecks, coordination losses
Optimal gang size exists for each activity type


- Use to teach capitals and lowercase letters in print and cursive in a fun multisensory mode.
- Encourages muscle memory through repetition of writing and finger tracing.
- Use the “Wet-Dry-Try” activity for fun repetition.
4. Analogous Estimating: Historical Data Method
Analogous estimation uses actual durations from similar past projects.
4.1 When to Use Analogous Estimating
Best for:
- Repetitive work (similar building types)
- Early project stages (concept/bid phase)
- Experienced estimators with good historical data
Example projects for analogous:
textPast: 80,000 sq ft office (3 stories)
Current: 100,000 sq ft office (4 stories)
Similar enough for analogous estimation
textPast: Hospital (complex MEP, strict codes)
Current: Office building (standard MEP)
Not similar; analogous unreliable
4.2 Analogous Estimation Process
textStep 1: Identify similar past project
Step 2: Extract relevant activity durations
Step 3: Adjust for scope differences
Step 4: Adjust for condition differences
Step 5: Apply to current project

Example: Structural steel erection

Past project: 40,000 sq ft office, 120 tons steel
- Erection duration: 6 weeks
- Productivity: 120 tons ÷ 30 days = 4 tons/day

Current project: 100,000 sq ft office, 300 tons steel
- Raw estimate: 300 ÷ 4 = 75 days = 15 weeks
- Adjustments:
  * Larger project (better crew continuity): -10%
  * More complex geometry: +15%
  * Experienced crew: -5%
- Net adjustment: +0%
- Final estimate: 15 weeks ✓
4.3 Pros & Cons
| Method | Pros | Cons |
|---|---|---|
| Analogous | Fast; based on real data; good for bids | Limited to similar projects; perpetuates past inefficiencies |
5. Parametric Estimating: Productivity-Based Approach
Parametric uses productivity rates per unit of work (sq ft, tons, linear feet).
5.1 Parametric Formula
Duration (days)=Productivity Rate×Number of CrewsTotal Quantity
Example: Concrete foundation
textQuantity: 1,200 cubic yards
Productivity: 12 cubic yards/day/crew
Crews: 2
Duration = 1,200 ÷ (12 × 2) = 50 days
5.2 Construction Productivity Benchmarks
Industry-standard rates (adjusted for conditions):
| Trade/Activity | Ideal Rate | Average Rate | Poor Conditions |
|---|---|---|---|
| Concrete pour | 15 cy/day/crew | 12 cy/day/crew | 8 cy/day/crew |
| Drywall hanging | 1,500 sf/day/crew | 1,000 sf/day/crew | 600 sf/day/crew |
| Steel erection | 5 tons/day/crew | 4 tons/day/crew | 2.5 tons/day/crew |
| Electrical rough-in | 25 outlets/day/elec | 20 outlets/day/elec | 12 outlets/day/elec |
| Painting | 2,000 sf/day/painter | 1,500 sf/day/painter | 1,000 sf/day/painter |
cy = cubic yards, sf = square feet, elec = electrician
5.3 Crew Size Optimization
textConcrete example:
1 crew: 1,200 cy ÷ 12 cy/day = 100 days
2 crews: 1,200 cy ÷ 24 cy/day = 50 days
3 crews: 1,200 cy ÷ 33 cy/day = 36 days (diminishing returns)

Optimal: 2 crews (best cost/time balance)
6. Bottom-Up Estimating: Detailed Task Analysis
Break work into small components; estimate each; sum totals.
6.1 Bottom-Up Process
textExample: Partition wall (1,000 sf total)

FRAMING (2.9 days):
├─ Layout/marking: 4 hours
├─ Cut plates/studs: 6 hours
├─ Install studs/blocking: 10 hours
└─ Install fixture backing: 3 hours
Total: 23 hours ÷ 8 hr/day = 2.9 days

DRYWALL (3.75 days):
├─ Hanging: 12 hours (2 crew)
├─ Tape/mud coat 1: 6 hours
├─ Tape/mud coat 2: 5 hours
├─ Tape/mud coat 3: 4 hours
└─ Sanding: 3 hours
Total: 30 hours ÷ 8 hr/day = 3.75 days

Total wall duration: 6.65 days (round to 7 days)
6.2 Bottom-Up Checklist
- Include mobilization/demobilization
- Include material handling/unloading
- Include cleanup between activities
- Include rework allowance (5-10%)
- Include inspection/testing time
- Verify crew size appropriate for task
7. PERT Three-Point Estimating: Risk-Adjusted Method
PERT accounts for uncertainty using optimistic, likely, pessimistic estimates.
7.1 PERT Formula
Expected Duration=6O+4L+P
O = Optimistic, L = Likely, P = Pessimistic
Worked Example: Steel Erection
textOptimistic: 6 weeks (perfect weather, no rework)
Likely: 8 weeks (normal conditions)
Pessimistic: 12 weeks (weather delays, bolt misalignment)

Expected = (6 + 4×8 + 12) ÷ 6 = (6 + 32 + 12) ÷ 6 = 8.33 weeks
7.2 Standard Deviation (Risk Measure)
σ=6P−O
textSteel erection: σ = (12 - 6) ÷ 6 = 1 week
68% chance completion within ±1 week of expected
95% chance completion within ±2 weeks of expected
8. Advanced Duration Estimating Techniques
8.1 Learning Curve Effect
Productivity improves with repetition:
textWeek 1: 100 sf/day/crew (learning)
Week 2: 120 sf/day/crew (10% improvement)
Week 3: 130 sf/day/crew (8% improvement)
Week 4+: 140 sf/day/crew (steady state)

Total for 20 days:
Naive: 20 × 140 = 2,800 sf
Learning-adjusted: (5×100 + 5×120 + 5×130 + 5×140) = 2,650 sf
Duration adjustment: +1.1 days (5% longer)
8.2 Weather Adjustment Factors
textOutdoor concrete work (Northern climate):
Summer (Jun-Aug): 100% productivity
Spring/Fall (Mar-May, Sep-Nov): 85% productivity
Winter (Dec-Feb): 60% productivity

Annual adjustment: (3×100 + 6×85 + 3×60) ÷ 12 = 84% of ideal
Duration increase: 1 ÷ 0.84 = 1.19× (19% longer)
9. Construction Productivity Rates & Benchmarks
9.1 Trade-Specific Benchmarks
| Trade | Activity | Ideal Rate | Typical Rate | Poor Conditions |
|---|---|---|---|---|
| Concrete | Formwork | 200 sf/day/crew | 150 sf/day/crew | 100 sf/day/crew |
| Concrete | Rebar | 2 tons/day/crew | 1.5 tons/day/crew | 1 ton/day/crew |
| Steel | Erection | 5 tons/day/crew | 4 tons/day/crew | 2.5 tons/day/crew |
| Carpentry | Framing | 400 sf/day/crew | 300 sf/day/crew | 200 sf/day/crew |
| Drywall | Hanging | 1,500 sf/day/crew | 1,000 sf/day/crew | 600 sf/day/crew |
| Electrical | Rough-in | 25 outlets/day | 20 outlets/day | 12 outlets/day |
9.2 Regional Productivity Adjustments
textUS Northeast (union labor): 100% baseline
US South (non-union): 110-120% baseline
Middle East (expat labor): 80-90% baseline
India (local labor): 90-110% baseline
10. Tools & Software for Duration Estimation
10.1 RSMeans / Craftsman Books
Industry-standard cost/productivity databases:
- 20,000+ line items with productivity rates
- Regional adjustments
- Crew composition recommendations
- Updated annually
Cost: $500-1,500/year
10.2 Timberline / Sage Estimating
Integrated estimating software:
- Parametric rates built-in
- Historical data tracking
- Automatic duration calculation
- Integrates with scheduling
Cost: $5,000-15,000/year
10.3 Excel Templates
Free/customizable:
textColumns: Activity | Quantity | Unit | Ideal Rate | Adjustment | Actual Rate | Duration
Formulas auto-calculate durations
Simple but effective for small projects
11. Common Mistakes in Duration Estimating
11.1 Using Ideal Productivity Rates
Mistake: Apply lab conditions to real sites
textDrywall: Use 1,500 sf/day → actual 800 sf/day = 88% overrun
Solution: Apply realistic adjustment factors (60-85% of ideal)
11.2 Ignoring Mobilization/Demobilization
Mistake: Only estimate productive work
textFraming: Estimate 10 days → forget 2 days mobilization = 20% short
Solution: Add 10-20% for setup/cleanup
11.3 Linear Crew Scaling
Mistake: Double crew = half time (false)
text2 crews don't always = 2× productivity
Solution: Use tested crew balance data
11.4 No Weather/Seasonal Adjustment
Mistake: Same rates year-round
textWinter concrete: Same speed as summer = disaster
Solution: Seasonal productivity factors
11.5 Single-Point Estimates
Mistake: “It’ll take 10 days” (no risk)
textReality: 8-14 days range
Solution: PERT three-point estimation
12. Case Studies & Real-World Examples
12.1 Case Study: 120,000 sq ft Office Building
Challenge: Bid phase; needed duration estimates in 2 weeks
Approach:
textMethod 1: Analogous (past 80K sf office): Framing 8 weeks
Method 2: Parametric (300 sf/day/crew × 20 crews): Framing 10 weeks
Method 3: Bottom-up (detailed task list): Framing 9.5 weeks

Final estimate: 9.5 weeks (bottom-up verified)
Actual: 9.8 weeks (2.8% variance) ✓ Excellent accuracy
12.2 Case Study: Hospital Expansion (High Complexity)
Challenge: Complex MEP, strict codes, phased occupancy
Approach: PERT three-point
textHVAC installation:
O: 12 weeks, L: 18 weeks, P: 28 weeks
Expected: (12 + 4×18 + 28) ÷ 6 = 19.3 weeks

Actual: 20.1 weeks (4% variance) ✓
Result: Schedule held; no liquidated damages
13. FAQ
Q1: Which estimating method is most accurate?
A: Bottom-up is most accurate for detailed work packages. Use parametric for early bids, analogous for similar projects, PERT for high uncertainty.
Q2: How much contingency should I add to duration estimates?
A: 5-15% depending on risk. Low-risk repetitive work: 5%. Novel/complex work: 15%. Weather-heavy outdoor work: additional 10-20%.
Q3: Should I use ideal or average productivity rates?
A: Average rates (70-85% of ideal). Ideal rates create 20-40% schedule underruns.
Q4: How often should I update duration estimates?
A: Monthly during execution. Compare actual vs. estimated; adjust future estimates based on performance.
Q5: What’s the biggest source of duration estimation error?
A: Ignoring non-productive time (mobilization, weather, coordination, rework). Productive work is only 60-80% of calendar duration.
Q6: Can software replace estimator judgment?
A: No. Software provides benchmarks; experienced estimators adjust for site conditions, crew quality, complexity.
Q7: How do I validate my duration estimates?
A: Cross-check with multiple methods. If analogous, parametric, and bottom-up converge within 10-15%, confidence is high.
Q8: What’s typical framing duration for a 3-story office?
A: 6-10 weeks depending on size (40K-100K sf), crew size, weather. Use parametric: 300 sf/day/crew × 20 crews = ~10 weeks for 100K sf.
14. Conclusion
Activity duration estimating techniques separate successful construction projects from troubled ones. Accurate estimates create realistic schedules that:
✅ Protect profits: Right-size crews, avoid idle time
✅ Build credibility: Schedules that reflect reality gain stakeholder trust
✅ Enable control: Know when delays occur, take corrective action
✅ Support claims: Credible baselines prove entitlement to time extensions
✅ Forecast completion: Realistic visibility into project finish
Key takeaways:
- No single method fits all: Use analogous for bids, parametric for planning, bottom-up for execution, PERT for risk
- Calendar duration ≠ labor hours: Include mobilization, weather, coordination (60-80% productive time typical)
- Productivity is contextual: Adjust ideal rates 60-85% for real conditions
- Validate with multiple methods: Convergence within 10-15% builds confidence
- Update continuously: Monthly actual vs. estimate comparison improves future accuracy
- Document assumptions: Every adjustment must be defensible for claims
Next steps:
- Download free productivity benchmark spreadsheet (link below)
- Benchmark your last 3 projects against industry standards
- Implement PERT for your next high-risk bid
- Join Famcod’s estimating masterclass (Coursera link below)
Master duration estimation, and you’ll master construction scheduling.
Free Resources Available
Download exclusive Famcod estimating resources:
- Construction Productivity Benchmark Spreadsheet (Excel)
- PERT Three-Point Calculator Template
- Duration Estimating Checklist (PDF)
- Crew Balance Optimization Worksheet
Sign up for instant access + weekly construction PM tips.
Related Articles on Famcod
Recommended Resources
Books:


Courses:
- Coursera: “Construction Management Fundamentals Specialization”
University of Maryland course covering parametric and bottom-up methods.
Coursera Affiliate Link - More Construction courses